| Issue |
A&A
Volume 705, January 2026
|
|
|---|---|---|
| Article Number | A254 | |
| Number of page(s) | 12 | |
| Section | Extragalactic astronomy | |
| DOI | https://doi.org/10.1051/0004-6361/202555280 | |
| Published online | 23 January 2026 | |
The spatial distribution of dwarf and giant galaxies in and around the Virgo cluster
1
Instituto de Astronomía y Ciencias Planetarias, Universidad de Atacama Copayapu 485 Copiapó, Chile
2
Departamento de Física, Universidad Técnica Federico Santa María Av. Vicuña Mackenna 3939 8940897 San Joaquín Santiago, Chile
3
Instituto de Astrofísica de Canarias E-38200 La Laguna Tenerife, Spain
4
Departamento de Astrofísica, Universidad de La Laguna Avenida Astrofísico Francisco Sánchez s/n 38206 La Laguna Tenerife, Spain
5
Millenium Nucleus for Galaxies (MINGAL) Valparaíso, Chile
★ Corresponding author: This email address is being protected from spambots. You need JavaScript enabled to view it.
Received:
24
April
2025
Accepted:
22
October
2025
Abstract
The Virgo cluster is one of the closest clusters to us where we can further study the evolution of galaxies, with several infalling substructures and several filaments around it that have been reported. Therefore, it makes this cluster and its surrounding area an interesting place to study the spatial distribution of the population of dwarf and bright giant galaxies. We analysed the dwarf fraction (DF) in different regions of the cluster, inside the virial radius, in its surrounding area, and in the filamentary structure surrounding it using available catalogues with the aim of measuring whether the DF changes in different environments. Although the total dwarf fraction within the cluster is ∼0.8, significant local variations are measured throughout the cluster; there are regions with a relatively higher concentration of giant or dwarf galaxies. The fact that Virgo is embedded in a rich environment surrounded by several filaments that feed the cluster with new substructures could imply changes in the DF locally. When we analysed the DF variation at further distances from the cluster we observe some regions with few or no giant galaxies at all, with a local DF ranging from 0.8−1.0. Additionally, when comparing the dwarf fraction in different environments, overall the DF is larger in regions further away from denser regions such as the Virgo cluster and its filamentary structure surrounding it. When comparing the filament and the cluster area, the DF is slightly higher in the filaments, but from filament to filament, the DF changes depending on the presence of groups.
Key words: galaxies: clusters: general / galaxies: dwarf / galaxies: clusters: individual: Virgo
© The Authors 2026
 Open Access article, published by EDP Sciences, under the terms of the Creative Commons Attribution License (https://creativecommons.org/licenses/by/4.0), which permits unrestricted use, distribution, and reproduction in any medium, provided the original work is properly cited.
This article is published in open access under the Subscribe to Open model. This email address is being protected from spambots. You need JavaScript enabled to view it. to support open access publication.
1. Introduction
Galaxies are distributed in a complex structure in the so-called cosmic web, from dense regions in nodes, which are connected through filaments, to voids in the lowest-density regions (Haynes & Giovanelli 1986). In the densest regions, galaxy clusters form and grow through the accretion of galaxies from the outskirts. Therefore, in these different environments galaxies are subject to different processes that shape their evolution. An examination of the galaxy population in different environments facilitates our understanding of the processes that shape galaxy evolution, for example by studying the luminosity function (LF) in different environments (e.g. Sabatini et al. 2003; Agulli et al. 2017). The steepness of the faint-end slope of the LF gives us some indication of the abundance of less massive galaxies compared to the abundance of bright galaxies. Quite related and complementary to the LF is the use of the dwarf-to-giant ratio (DGR; Ferguson 1992; Sabatini et al. 2005; Popesso et al. 2006) in clusters.
The DGR actually gives us information about the distribution of dwarf galaxies in clusters, hinting at an explanation of their evolution, and provides some insight into the hierarchical assembly history of galaxies in the large-scale picture. Several studies have quantified the DGR in several clusters and have found, for example, that it increases with a larger cluster-centric radius (e.g. Barkhouse et al. 2009; Rude et al. 2020). In any case, any change in the DGR with the cluster-centric distance could be due to the variation of giants, dwarfs, or both, as pointed out in Sánchez-Janssen et al. (2008). The decrease in the DGR when going to the innermost region of the cluster could be due to galaxy disruption, as gravitational tidal interactions become more frequent (Trujillo et al. 2002; Aguerri et al. 2004; Rude et al. 2020) or to an increase in giants due to mass segregation. Similarly, the dwarf-to-giant ratio has been studied as a function of some cluster properties, for example to determine whether there is a correlation with the cluster mass, velocity dispersion, and X-ray luminosity (e.g. Popesso et al. 2006). The results on this aspect vary widely, with some works finding a correlation, and others finding insignificant correlations with the cluster parameters (e.g. Popesso et al. 2006; Bildfell et al. 2012; Hashimoto et al. 2018; Choque-Challapa et al. 2021). In addition to the connection of DGR to the environment, some observational studies have also quantified how it changes over time and found an evolving DGR, that is, a higher DGR at higher redshifts (e.g. De Lucia et al. 2007; Bildfell et al. 2012) supporting the hierarchical merging scenario where a higher fraction of smaller galaxies are expected at higher redshift.
Located at a distance of approximately 16.5 Mpc (Mei et al. 2007) with a mass of ∼7 ± 0.4 × 10¹⁴ M⊙, Karachentsev et al. (2014), the Virgo cluster is one of the closest massive galaxy clusters. Due to its proximity, this is a well-studied galaxy cluster, with several photometric and spectroscopic catalogues available to study galaxy evolution. Within this system the mass assembly is ongoing. Observations indicate the presence of numerous substructures that are currently falling into the cluster (Binggeli et al. 1985, 1993; Böhringer et al. 1994; Lisker et al. 2018). Furthermore, an extensive network of red filaments encircles the cluster (Kim et al. 2016; Chung et al. 2021; Castignani et al. 2022b). Consequently, this region, encompassing both the cluster and its surroundings, presents a compelling site for investigating its galaxy populations.
The properties of the population of bright giant and dwarf galaxies in Virgo have been widely studied (e.g. Binggeli et al. 1985; Aguerri et al. 2005; Lisker et al. 2007; Janz et al. 2016; Kim et al. 2024), and there is also an increasing number of studies on the filamentary structure around the cluster (Chung et al. 2021; Castignani et al. 2022b; Zakharova et al. 2024). It also becomes interesting to analyse their spatial distribution in and around this massive cluster (e.g. Einasto 1988, 1991; Sabatini et al. 2003).
Regarding the distribution of galaxies in the Virgo cluster, for example, Sabatini et al. (2003) analysed a sample of dwarfs with magnitudes of −14 ≤ MB ≤ −10 mag and giants with MB ≤ −19 mag and measured that the dwarf-to-giant ratio remains flat with increasing distance (out to ∼4 deg) from the central galaxy M87, with a median value of ∼20. Similarly, Roberts et al. (2004) performed an analysis of the Millennium Galaxy strip, which includes the Virgo cluster, and found a similar DGR value for the cluster, while the ratio along the strip ranges from 0.7 to, at most, 6, which corresponds to a flat luminosity function. One caveat when comparing this DGR value in the same cluster and also with other clusters is the different definitions of dwarfs and giant galaxies that studies use, and some possible contamination from background galaxies when redshift is not available (Hashimoto et al. 2018). In addition to the DGR, Sabatini et al. (2005) analysed the dwarf-galaxy distribution in the Virgo cluster and found that a significant fraction of dwarf galaxies are not bound with giant galaxies. This apparently non-associated population of dwarfs corresponds to 40%. Similar results were already pointed out in Ferguson (1992).
While the majority of studies have been focused on the ‘global’ dwarf-to-giant ratio within the virial radius (R2001), it is also of significant interest to analyse this ratio in different regions of the cluster and at larger distances, and to see what we can learn from this. For example, the DGR could tell us more about the assembly history of clusters by assessing how it changes as a function of cluster-centric and filament distance and within substructures in and around a galaxy cluster. Moreover, one could also learn about the evolution of the dwarf galaxies via their falling into the clusters. Therefore, in this analysis, we delve further into this aspect in the Virgo cluster and its surrounding environment analysing the spatial distribution of its dwarf and giant bright galaxies on different scales.
The paper is organised as follows. Section 2 describes the data sample we use in this analysis. The spatial distribution analysis of our target sample is presented in Sect. 3. In Sect. 4, we discuss and summarise our main results. Throughout this work, we adopted a Λ cold dark matter (ΛCDM) cosmology with Ωm = 0.3, ΩΛ = 0.7, and H0 = 70 km s−1 Mpc−1 and a distance module in Virgo, m − M = 31.09 (Jerjen 2003; Mei et al. 2007), and adopted the M87 galaxy as the centre of the Virgo cluster.
2. Data
2.1. Catalogues
In this analysis, we make use of different available catalogues that cover different areas around the Virgo cluster providing us with photometric and spectroscopic information. We used the Extended Virgo Cluster Catalogue (EVCC; Kim et al. 2014), which is based on the Sloan Digital Sky Survey (SDSS) Data Release 7 and is an extension of the Virgo Cluster Catalogue (VCC; Binggeli et al. 1985). The EVCC covers an area of 725 deg2 or 60 Mpc2 reaching out ∼3.5 times the virial radius of Virgo (but mainly in the northern hemisphere). Additionally, this catalogue contains 1324 galaxies with radial velocities and SDSS r, i, g, and u photometry, where the apparent magnitudes go down to mr ∼ 20 mag in the r band.
Similarly, we made use of the Castignani et al. (2022b) galaxy catalogue, which covers a huge area in the northern hemisphere surrounding the Virgo cluster (extending out to a virial radius of ∼12). This catalogue combines galaxies from Hyperleda (Makarov et al. 2014), Nasa Sloan Atlas (NSA; Blanton et al. 2011), ALFALFA (Haynes et al. 2018), and NED-D (Steer et al. 2017) containing a total of 6780 galaxies with radial velocity of 300 < vr < 3300 km s−1. In order to have a homogeneous photometric sample for our analysis, we only selected galaxies from the NSA and retrieved their corresponding r-band photometry. Both the EVCC and the NSA-Castignani catalogues have a completeness magnitude, mr, of up to ∼17 mag.
Furthermore, given that both catalogues only cover the northern hemisphere, we also made use of the catalogue described in Makarov & Karachentsev (2011), which gathers data from the Hyperleda (Paturel et al. 2003) and the NASA Extragalactic Database (NED) for photometry and radial velocities. This catalogue covers not only the northern area around Virgo, but also a large portion in the southern hemisphere (around 40°), and it contains ∼10 000 galaxies with radial velocities of < 3500 km s−1 (z < 0.01). It provides K-band photometry down to a magnitude of mK ∼20 mag (but with a completeness magnitude, mk, of up to ∼13 mag). In Fig. 1, we show the coverage of each catalogue and the limit of the magnitude range we use in this analysis.
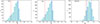 |
Fig. 1. Absolute magnitude range of galaxies in the EVCC (r band, left panel), NSA-Castignani (r band, middle panel), and Hyperleda (K band, right panel) catalogues. The dashed red line indicates the threshold limit that we used to separate giant (left side) from dwarf (right side) galaxies in the EVCC and NSA catalogues. The rightmost dashed blue line marks the limit imposed on dwarf galaxies to ensure the completeness of magnitudes of each catalogue. The blue dashed lines in the third panel indicates the Mk range to select dwarf galaxies in the Hyperleda catalogue. We note that absolute magnitudes are measured at the distance of Virgo. |
2.2. Selection of dwarf and giant galaxies
In the current analysis, we make use of different catalogues since they cover different areas around the Virgo cluster. For the EVCC and NSA-Castignani catalogues, our definition is based on the r band, so we considered faint (‘dwarf’) galaxies as those with −19 ≤ Mr ≤ −14 mag. The faint limit was imposed to ensure the completeness of the catalogue (as shown in Fig. 1). Bright (‘giant’) galaxies were defined as those with Mr < −19.0 mag2. This luminosity-based limit follows the historical convention of classifying dwarf galaxies as those with MB > −18 mag (Binggeli et al. 1988), assuming a typical colour of B − r ∼ 1.0 mag for such galaxies. Similar to previous studies that rely solely on luminosity to distinguish dwarfs from giants (e.g. Popesso et al. 2006; Rude et al. 2020), hereafter we refer to faint and bright galaxies by the as ‘dwarfs’ and ‘giants’, respectively.
For the catalogue from Makarov & Karachentsev (2011) that comes from the Hyperleda database, our selection of bright and dwarf galaxies was done using the K-band magnitude. Therefore, we define dwarfs as those with MK between −21 mag and −17 mag. Similarly, this faint limit was imposed to ensure the completeness of the catalogue (as shown in the third panel in Fig. 1). We define giant galaxies as those with a K-band magnitude brighter than −22 mag3. We highlight that this selection done in the K band is not the same as that done in the other catalogues when we used the r band for the selection; in addition, the completeness (in magnitude) of the catalogues is different, as well as the number of galaxies in each region. Consequently, we expect the results and trends found in this catalogue to be similar to the others, but not exactly the same, and therefore we do not intend to compare them directly.
Although it is common to use the DGR quantity (number of dwarf galaxies divided by the number of giant galaxies) to compare the spatial distribution of dwarf and bright giant galaxies, when one wants to measure this ratio locally in different regions of the cluster, it makes more sense to estimate the dwarf fraction (DF) as the ratio between the number of dwarf galaxies (Nd) and the number of giant galaxies (Ng) plus dwarf galaxies: DF = Nd/(Ng + Nd). This is to avoid division by zero because there are regions populated mainly by dwarfs without any giant galaxies, as we show later; henceforth, we mainly use this quantity.
In Table 1, we show the number of giant and dwarf galaxies, as determined by our criteria for the EVCC catalogue, considering both the entire field of view and the region within the cluster’s R200 radius4. We also report the corresponding dwarf fraction. The DF value we obtain inside the R200 radius when using the entire magnitude range of the catalogue becomes 0.85, whereas it is 0.83 when limiting the catalogue to Mr = −14 mag (limit to ensure the completeness of the catalogue). We note that the DF value we estimate here is a ‘global’ measurement, and although it gives us a measure that helps us to know more about the number of dwarfs with respect to giant galaxies, it does not give us much information about how they are distributed in clusters.
Number of dwarf and giant galaxies in the EVCC catalogue (up to an absolute magnitude, Mr = −14 mag).
3. Results
3.1. Distribution of giants and dwarfs in the Virgo cluster
The analysis of the spatial distribution of galaxies could not only give us information about how they are distributed in and around the clusters but also tell us more about the assembly history of clusters and so help us to better understand the galaxy evolution. Thus, in Fig. 2 we show the spatial projected distribution of the giant and dwarf population in the Virgo cluster up to 1 R200. Visually inspecting the distribution of dwarfs and bright galaxies in the figure, we can see that in the left panel the giant bright galaxies are widely spread across the cluster similarly to the dwarf population, which is also seen in the cumulative function of the cluster-centric distances shown in the middle panel. In fact, by carrying out a Kolmogorov-Smirnov (KS) test between the dwarf and giant distributions, in Virgo both radial distributions are statistically similar (p value = 0.56, and 0.36 when limiting the catalogue to Mr = −14 mag). Furthermore, when we measure the dwarf fraction in concentric radius bins of 0.2 R200 (right panel of the figure) across the cluster, it does not change much; the values remain in 0.7−0.9 (when DF is measured using the entire catalogue and when it is limited to the completeness magnitude limit: Mr = −14 mag). However, we notice that even when dwarf and giant galaxies are widely distributed across the cluster, there are regions with a higher concentration of dwarfs or bright, massive giant galaxies. Therefore, one way to better see the distribution of dwarf and giant galaxies is to measure the DF locally in different regions of the cluster. Thus, in the left panel of Fig. 3 we show the spatial distribution of the galaxies in the virialised region of the cluster (using the EVCC up to an absolute magnitude of Mr = −14 mag5), where we calculated the DF in different local regions. That is, for each galaxy we selected its 14 nearest neighbours, thereby defining a ‘local’ region containing 15 galaxies in total. Neighbour selection is based on projected distances measured in two dimensions using the RA and Dec coordinates. The DF was then computed by counting the number of dwarfs (Nd) and giants (Ng) within this local neighbourhood and taking the ratio of dwarfs to the total number of galaxies (Nd + Ng). This way, every galaxy has an associated projected DF value (shown as colours in Fig. 3).
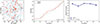 |
Fig. 2. Left panel: Projected spatial distribution of dwarfs (blue open symbols) and giants (red filled symbols) from the EVCC catalogue. The black cross indicates the position of M87. The dashed circle indicates the R200 region of the Virgo cluster. Middle panel: Cumulative distributions of cluster-centric distance of giant and dwarf galaxies inside R200 of Virgo cluster. We note that in both panels the galaxy distribution is limited to Mr = −14 mag. Right panel: Dwarf fraction (DF, measured in bins of distance) as a function of projected cluster-centric distance, measured for the EVCC catalogue without magnitude threshold (dashed line) and for galaxies up to an absolute magnitude, Mr = −14 mag (filled line). |
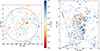 |
Fig. 3. Galaxy spatial distribution in EVCC area. The red circle highlights the R200 radius of the Virgo cluster. Left: DF in cluster region. Right: DF in entire field of view of EVCC catalogue. The grey circles highlight the groups from the galaxy group catalogue of Kourkchi & Tully (2017). The northern grey lines highlight the filaments of the Castignani et al. (2022b) catalogue. The two filaments in the south were extracted from Fig. 2 of Castignani et al. (2022a). The colour bar in each panel denotes the DF associated with each galaxy, as quantified by considering its 15 nearest neighbours. |
We notice that there are several zones with a high concentration of massive giant galaxies (redder coloured points), with a DF of ∼0.6, meaning that at least ∼40% of the galaxies in that neighbourhood are massive or giant objects. These regions are in fact related to the galaxy substructures already found in this cluster, for example M86, M84, M60, and M49. In other regions of the cluster, we observe a predominance of dwarf galaxies with a DF ≥ 0.8 (bluer coloured points).
3.2. Fraction of dwarf galaxies around Virgo
To see how the DF changes not only across the cluster but also at greater distances, in the right panel of Fig. 3 we show the entire EVCC area that covers a region of ∼25 × 25 deg2. Looking in the surrounding area of the cluster, we notice some patches with a higher concentration of giants that seem to be correlated with the groups falling into the cluster. We also observe that there are regions with a high concentration of dwarfs (DF ≥ 0.8), for example in the lower right region outside the cluster and, in some cases, there are no giants. One possible explanation for this is that they are galaxies in groups composed mainly of dwarf galaxies. A better understanding of how the DF changes on a larger scale could help us understand how the DF changes inside the Virgo cluster; for instance, we could have an idea of how the surrounding area is feeding the cluster with dwarf and giant galaxies and thus increasing or decreasing the DF inside the cluster.
In Fig. 4, we show the DF calculated using the NSA-Castignani galaxy catalogue. This catalogue covers a large area around Virgo (but only in the northern hemisphere, ∼60° in declination and around 100° in right ascension, as shown in the figure), where we explore the DF across it, for example in the various filaments around Virgo reported in previous works (e.g. Castignani et al. 2022b). Similarly to what we did for the EVCC, we limited the sample to DF estimation up to Mr = −14 mag (to ensure completeness of the catalogue). As can be seen in the figure, in some filaments there are in regions with a relatively high concentration of giant galaxies (as might be expected in dense regions; see, e.g. the filament in the northern zone) known as the Ursa Major cloud as reported in the literature. However, we also note that there are other filaments with a fairly large fraction of dwarf galaxies; for example, the ‘small’ filament in (RA, Dec) ∼ (170, 35) degrees appears to be composed mainly of dwarf galaxies (DF > 0.9). This could be because this filament is relatively new and/or the dwarf galaxies in these filaments only belong to small galaxy groups. In fact, a number of studies have reported groups with only dwarf galaxies (Stierwalt et al. 2017).
By visually examining this figure, we can gain a qualitative understanding of the DF’s variation across different environments. For example, there is a higher concentration of dwarfs in filaments compared to the cluster and a high fraction of dwarf galaxies in regions that are distant from the cluster and filaments. We also note that the groups in filaments have different fractions of dwarf galaxies. A more detailed comparison between the different environments is further explored in the next section. In addition, as a consistency check, in Appendix A we present measurements of the local DF in Cartesian supergalactic coordinates, analogous to those shown in Fig. 4, while also accounting for the influence of local attractors (Mould et al. 2000; Castignani et al. 2022b). We find no significant differences compared to the local DF obtained in RA–Dec coordinates.
Although with the NSA-Castignani catalogue we can explore a huge area around Virgo, we also intended to check how the DF locally changes in the southern region. To do this, we used the catalogue provided in Makarov & Karachentsev (2011, based on the Hyperleda database). However, given that this catalogue provides photometry in the K band only, we selected the dwarf and giant bright galaxies using this filter. Therefore, we might expect a similar trend in the results to that observed with the other catalogues; these would not necessarily be the same since the DF values measured now are based on this K-band catalogue. Thus, we show the DF distribution in both hemispheres around Virgo6 in Fig. 5. The Makarov & Karachentsev (2011) catalogue covers a much larger area; however, here we only show the area surrounding Virgo, where we covered all previously found filaments that could be associated with the Virgo cluster (see the lines in the figure and Castignani et al. 2022a,b). Note, for example, that in the dense (if not the densest) filament in the southern region, low values of the DF are measured, meaning a significant fraction of giant galaxies inhabit that area. In fact, we see regions with a DF of ∼0.5−0.7, meaning that at least 30% of the galaxies in that filament are brighter massive ones that seem to be related to the several groups of that filament (see grey circles in the figure). Similarly, we also see in the southernmost region (border) a relatively high fraction of bright giant galaxies that seem to be correlated with the several groups reported in that area. On the other hand, we again note places populated by higher concentrations of dwarf galaxies –for example the region around (RA, Dec) ∼ (160, −30)– which in some cases also seem to be related to the identified groups. We additionally note that, at least by eye, low-density regions not associated with groups or filaments tend to be bluer, meaning higher concentration of dwarfs. Therefore, looking at the large-scale structure in this figure and in Fig. 4, we see that the DF changes in different environments. The DF does not have the same value; it is different in filaments, in the cluster region, and even in the groups in various other locations (grey circles in the figure). We further discuss what might produce these changes in the DF in Sect. 4.
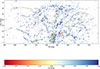 |
Fig. 4. Galaxy spatial projected distribution in large-scale structure around Virgo (northern hemisphere) from the NSA-Castignani catalogue (Castignani et al. 2022b). Colour indicates the local DF measured for each galaxy in the region enclosing its 15 near-neighbour galaxies. The red circle highlights the R200 radius of the Virgo cluster, while grey circles highlight the (loose and rich) groups from the galaxy group catalogue of Kourkchi & Tully (2017, in the velocity range 500 < vr < 3300 km s−1; the circle sizes correspond to the projected virial radius of the groups described in that work). The grey lines highlight the filaments of the Castignani et al. (2022a,b) catalogue: Leo Minor F, Canes Venatici F, Bootes F, Ursa Major Cloud, Leo II B F, Leo II A F, Virgo III F, Leo Minor B F, W–M Sheet, NGC 5353/4 F, Serpens F, Draco F, and Coma Berenices F. |
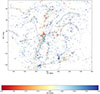 |
Fig. 5. Galaxy spatial projected distribution in large-scale structure around Virgo (including the southern hemisphere) from the Hyperleda catalogue described in Makarov & Karachentsev (2011). Colour indicates the DF of each galaxy measured in the region containing the 15 near-neighbour galaxies. The red circle highlights the Virgo cluster, while grey circles highlight the (loose and rich) groups from the galaxy group catalogue of Kourkchi & Tully (2017, in the velocity range 500 < vr < 3300 km s−1). The grey lines highlight the filaments of the Castignani et al. (2022b) catalogue. We note that all the filaments reported in Castignani et al. (2022b) are plotted in the figure: Leo Minor F, Canes Venatici F, Bootes F, Ursa Major Cloud, Leo II B F, Leo II A F, Virgo III F, Leo Minor B F, W–M Sheet, NGC 5353/4 F, Serpens F, Draco F, and Coma Berenices F. The two filaments in the south: Virgo Southern Extension and Crater were extracted from Castignani et al. (2022a, see their Fig. 2). |
3.3. DF in different environments
To check how the DF changes in different environments, we measured its distribution, which we estimated locally (as shown in Fig. 4). Three distinct environmental regions were defined: a high-density region, represented by the Virgo cluster (up to 1 R200); an intermediate-density region, comprising the surrounding filamentary structures; and low-density regions, corresponding to areas not included in the previously defined environments. We used the filament catalogue of Castignani et al. (2022b), which contains thirteen filaments in the northern hemisphere surrounding the Virgo cluster, as highlighted in Fig. 4. Thus, in Fig. 6 (left panel) we use the galaxy NSA-Castignani catalogue to show the distributions of the DF inside the cluster region (orange box), in the filamentary structure (green box), and in the remaining low-density regions7 (blue box). Overall, when comparing the three environments, we see that they span a wide range of DF values, as shown in Fig. 4, indicating that each environment contains local zones contributing both low and high DF values. In the Virgo-cluster region, however, the DF range extends slightly towards lower values compared to the filaments (see the peak in the distributions, the median values being 0.87 and 0.93, respectively). Since the Virgo cluster is a very dense region with several substructures falling into it, we expect an increase in the number of giant galaxies and, consequently, a decrease in the measured DF relative to the filaments. On the other hand, Fig. 4 qualitatively shows that some dense filaments also exhibit a higher contribution from massive galaxies (similar DF differences are also observed from group to group). In regions we classify as ‘low density’, although they span a DF range comparable to those of the other two environments, the contribution from local zones with higher DF values is slightly greater. This results in a marked concentration of dwarf galaxies, with DF values predominantly in the 0.8−1.0 range (median value being 0.93), as shown in Fig. 6. To complement this aspect, we also checked the spatial distribution of galaxies in Fig. 4 that have a very high DF (≥0.95) and a relatively low DF (≤0.75) and observed a similar trend with regard to the distribution of galaxies in different environments (see Fig. B.1). The galaxies with high DF are widely distributed in all environments with a predominance in less dense environments, whereas galaxies with low DF are concentrated in dense regions such as the cluster and in some filaments.
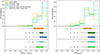 |
Fig. 6. DF distribution in different environments using NSA-Castignani catalogue (left) and Hyperleda catalogue (north hemisphere; right). Top panel: Distribution of DF values in Virgo-cluster region (orange), filamentary region (green), and low-density regions (blue). Additionally, we include the DF distribution of the filamentary region excluding galaxies belonging to groups (cyan) and vice versa, only including galaxies belonging to groups (lime). Bottom panels: Box plots of same distributions. We note that the box covers the first and third quartile of the data (e.g. between the 25th and 75th percentiles), while the line above it indicates the median value. The whiskers indicate the lowest and highest values still within 1.5 times the interquartile range, and the open dot symbols mark the outliers. |
In addition to the analyses of these three environments, for completeness we conducted a further analysis of the DF variation within the filamentary environment, specifically through a comparative analysis of results derived from the exclusion of galaxy groups with those derived from the exclusive consideration of galaxy groups in the filaments (bottom panel of Fig. 6). Galaxies belonging to groups were selected using the catalogue from Kourkchi & Tully (2017). As can be seen, the groups in filaments show a lower DF, as they contribute more massive galaxies than filaments without groups (see the lime box, which becomes wider and more extended to the left side, where the DF values are lower). Furthermore, we also checked the comparison in different environments using the Hyperleda catalogue (Makarov & Karachentsev 2011, in the northern area) and found similar trends (see the right panel in Fig. 6). Similarly, we also find similar trends when using the filamentary structure we detected with 1-DREAM (Canducci et al. 2022) as shown in Appendix C.
As a final step to complement our analysis of the DF in various environments, we briefly checked DF variations within galaxy groups reported by Kourkchi & Tully (2017, groups covering the area shown in Fig. 4). We calculated the mean local DF for each group by averaging the local DF values of its member galaxies. The resulting mean local DF values increase from approximately 0.6 to 1, which is consistent with the finding shown in Fig. 6 for the groups.
4. Discussion and conclusions
The present study is centred on the Virgo cluster, a nearby cluster situated within a highly enriched and dense environment, thereby constituting an advantageous location for examining the spatial distribution of dwarf and giant galaxy populations within the cluster and its surrounding regions. The main findings of this study are summarised as follows.
-
Even when the number of dwarfs is generally larger than the giant galaxies inside the Virgo cluster (inside 1 R200 the DF of ∼0.8), this does not mean that all regions in the cluster will have this value. In fact, there are local variations of the DF (Figs. 2 and left panel of Fig. 3).
-
The fact that the Virgo cluster is embedded in a rich environment, surrounded by several filaments that constantly supply the cluster with new substructures, leads to local variations in the DF within the cluster (Fig. 3).
-
Even inside the cluster and in its surrounding area there are regions with few or no giant galaxies at all. For example, with a local DF between 0.8 and 1.0. Similar giant-free regions are also observed at greater distances from the cluster in some filamentary regions and some in low-density regions (Figs. 3, 4, and 5).
-
When comparing the DF in different global environments, we find that the contribution of local regions with higher DF values is greater in low-density regions. This contribution tends to decrease in denser environments, such as in the filaments and within the Virgo cluster. A comparison between the filaments and the cluster area shows that local zones with high DF values are slightly more present in filaments. However, there are also variations in the DF from one filament to another, depending on the presence of galaxy groups (Figs. 6 and B.1).
In Sect. 3.1, we see that when we measure the total fraction of dwarf galaxies inside the R200 radius of the Virgo cluster it has a value of ∼0.8, meaning a high number of dwarf galaxies compared to massive galaxies, and this fraction does not change much when going farther from the cluster centre, similarly to found in previous studies (e.g. Sabatini et al. 2003). However, even though the trends are similar, a quantitative comparison with other studies is not simple because of the different definitions of dwarf and giant galaxies used (−19 ≤ Mr ≤ −14 mag and Mr < −19 mag for the dwarf and giant definitions used in this work). Similarly, because most previous studies have focused on measuring the dwarf fraction within a cluster’s virial radius or at relatively small distances from it, our results, which estimate the DF in local zones much farther from the cluster, such as in filaments and field regions, cannot be compared fairly.
On the other hand, even when dwarf and giant galaxies are widely distributed inside the cluster, we see that the DF actually changes in different regions of the cluster and in its surrounding area. There are regions with higher concentrations of giant galaxies, which in fact correlate with the groups falling into the cluster and thus contributing massive galaxies. In fact, looking at the surrounding area, there are several filaments feeding the cluster with groups that will eventually contribute giant and dwarf galaxies and thus produce changes in the DF in different regions of the cluster. At the same time, we might consider that, even though the number of dwarfs is generally larger in the cluster, they are more exposed to disruption by tidal forces and so one might expect some lower DF values in inner regions of the clusters. Therefore, in some ways, there is ‘competition’ between the gravitational tidal effect decreasing the DF and the feeding of galaxies coming from the filaments that might tend to increase the DF. However, even in dense regions such as the cluster or the near surrounding area there are some regions with a high concentration of dwarf galaxies that seem not to be correlated with any giant galaxy. Certainly, we have to keep in mind that we are looking at a projected distribution, but this does not mean that it is not important to understand those regions. In fact, these dwarf galaxies that seem not to be associated with giants in the Virgo cluster were already reported (Ferguson 1992; Sabatini et al. 2003). One possible explanation could be that they are groups composed mainly of dwarf galaxies, as has already been reported in the literature (e.g. Makarov & Uklein 2012; Stierwalt et al. 2017). On the other hand, they could be the remaining group members where the more massive galaxies sank to the densest region due to dynamical friction or they are dwarf galaxies that have been liberated from their former groups when their group was disrupted (Choque-Challapa et al. 2019; Benavides et al. 2020; Haggar et al. 2023). This fact is even more interesting to analyse when we look also at further distances from the cluster, for example in the filamentary structure surrounding it. One useful approach that could help to understand the physical processes shaping these regions with only dwarf galaxies would be the use of hydrodynamical cosmological simulations; for instance, we could track those regions in time and see how they became regions with few or no giant galaxies at all, or, vice versa, regions with higher concentration of giants. We will further analyse these aspects in a follow-up study.
Another interesting aspect we can see when we look at the DF measured on a large scale (Sects. 3.2 and 3.3) is the fact that even when the DF is higher in the filamentary region compared to the Virgo cluster, it changes from filament to filament (and so from group to group). Additionally, another interesting point to note is related to how dwarf and giant galaxies might fall into the cluster, because it seems that there are several regions with a high concentration of dwarfs that are not associated with groups or filaments. Overall, our results remain qualitatively consistent when adopting supergalactic coordinates (Appendix A). In the present analysis, we mainly studied the changes in the local DF in the Virgo cluster and on a large scale around it. However, in future work, we aim to compare our findings with those from clusters exhibiting different properties (e.g. dynamical state and surrounding environment).
Acknowledgments
We thank the referee for their useful comments and suggestions, which have contributed to improving the paper. NCC acknowledges a support grant from the Joint Committee ESO-Government of Chile (ORP 028/2020) and the support from FONDECYT Postdoctorado 2024, project number 3240528. RS acknowledges financial support from FONDECYT Regular 2023 project No. 1230441 and also gratefully acknowledges financial support from ANID – MILENIO NCN2024_112. JALA acknowledges support from the Agencia Estatal de Investigación del Ministerio de Ciencia, Innovación y Universidades (MCIU/AEI) under Grant ‘WEAVE: EXPLORING THE COSMIC ORIGINAL SYMPHONY, FROM STARS TO GALAXY CLUSTERS’ and the European Regional Development Fund (ERDF) with reference PID2023-153342NB-I00/10.13039 501100011033.
References
- Aguerri, J. A. L., Iglesias-Paramo, J., Vilchez, J. M., & Muñoz-Tuñón, C. 2004, AJ, 127, 1344 [NASA ADS] [CrossRef] [Google Scholar]
- Aguerri, J. A. L., Gerhard, O. E., Arnaboldi, M., et al. 2005, AJ, 129, 2585 [CrossRef] [Google Scholar]
- Agulli, I., Aguerri, J. A. L., Diaferio, A., Dominguez Palmero, L., & Sánchez-Janssen, R. 2017, MNRAS, 467, 4410 [Google Scholar]
- Arnaud, M., Pointecouteau, E., & Pratt, G. W. 2005, A&A, 441, 893 [NASA ADS] [CrossRef] [EDP Sciences] [Google Scholar]
- Awad, P., Canducci, M., Balbinot, E., et al. 2024, A&A, 683, A14 [NASA ADS] [CrossRef] [EDP Sciences] [Google Scholar]
- Barkhouse, W. A., Yee, H. K. C., & López-Cruz, O. 2009, ApJ, 703, 2024 [Google Scholar]
- Benavides, J. A., Sales, L. V., & Abadi, M. G. 2020, MNRAS, 498, 3852 [Google Scholar]
- Bildfell, C., Hoekstra, H., Babul, A., et al. 2012, MNRAS, 425, 204 [Google Scholar]
- Binggeli, B., Sandage, A., & Tammann, G. A. 1985, AJ, 90, 1681 [Google Scholar]
- Binggeli, B., Sandage, A., & Tammann, G. A. 1988, ARA&A, 26, 509 [NASA ADS] [CrossRef] [Google Scholar]
- Binggeli, B., Popescu, C. C., & Tammann, G. A. 1993, A&AS, 98, 275 [NASA ADS] [Google Scholar]
- Blanton, M. R., Kazin, E., Muna, D., Weaver, B. A., & Price-Whelan, A. 2011, AJ, 142, 31 [NASA ADS] [CrossRef] [Google Scholar]
- Böhringer, H., Briel, U. G., Schwarz, R. A., et al. 1994, Nature, 368, 828 [CrossRef] [Google Scholar]
- Canducci, M., Awad, P., Taghribi, A., et al. 2022, Astron. Comput., 41, 100658 [NASA ADS] [CrossRef] [Google Scholar]
- Castignani, G., Combes, F., Jablonka, P., et al. 2022a, A&A, 657, A9 [NASA ADS] [CrossRef] [EDP Sciences] [Google Scholar]
- Castignani, G., Vulcani, B., Finn, R. A., et al. 2022b, ApJS, 259, 43 [NASA ADS] [CrossRef] [Google Scholar]
- Choque-Challapa, N., Smith, R., Candlish, G., Peletier, R., & Shin, J. 2019, MNRAS, 490, 3654 [NASA ADS] [CrossRef] [Google Scholar]
- Choque-Challapa, N., Aguerri, J. A. L., Mancera Piña, P. E., et al. 2021, MNRAS, 507, 6045 [NASA ADS] [CrossRef] [Google Scholar]
- Chung, J., Kim, S., Rey, S.-C., & Lee, Y. 2021, ApJ, 923, 235 [NASA ADS] [CrossRef] [Google Scholar]
- De Lucia, G., Poggianti, B. M., Aragón-Salamanca, A., et al. 2007, MNRAS, 374, 809 [Google Scholar]
- Einasto, M. 1988, MNRAS, 234, 37 [Google Scholar]
- Einasto, M. 1991, MNRAS, 250, 802 [Google Scholar]
- Ferguson, H. C. 1992, MNRAS, 255, 389 [Google Scholar]
- Haggar, R., Kuchner, U., Gray, M. E., et al. 2023, MNRAS, 518, 1316 [Google Scholar]
- Hashimoto, Y., Henry, J. P., & Böehringer, H. 2018, MNRAS, 481, 981 [Google Scholar]
- Haynes, M. P., & Giovanelli, R. 1986, ApJ, 306, L55 [NASA ADS] [CrossRef] [Google Scholar]
- Haynes, M. P., Giovanelli, R., Kent, B. R., et al. 2018, ApJ, 861, 49 [Google Scholar]
- Janz, J., Laurikainen, E., Laine, J., Salo, H., & Lisker, T. 2016, MNRAS, 461, L82 [Google Scholar]
- Jerjen, H. 2003, A&A, 398, 63 [NASA ADS] [CrossRef] [EDP Sciences] [Google Scholar]
- Karachentsev, I. D., Tully, R. B., Wu, P.-F., Shaya, E. J., & Dolphin, A. E. 2014, ApJ, 782, 4 [NASA ADS] [CrossRef] [Google Scholar]
- Kim, S., Rey, S.-C., Jerjen, H., et al. 2014, ApJS, 215, 22 [Google Scholar]
- Kim, S., Rey, S.-C., Bureau, M., et al. 2016, ApJ, 833, 207 [NASA ADS] [CrossRef] [Google Scholar]
- Kim, S., Rey, S.-C., & Lee, Y. 2024, ApJ, 977, 231 [Google Scholar]
- Kourkchi, E., & Tully, R. B. 2017, ApJ, 843, 16 [NASA ADS] [CrossRef] [Google Scholar]
- Lisker, T., Grebel, E. K., Binggeli, B., & Glatt, K. 2007, ApJ, 660, 1186 [Google Scholar]
- Lisker, T., Vijayaraghavan, R., Janz, J., et al. 2018, ApJ, 865, 40 [Google Scholar]
- Makarov, D., & Karachentsev, I. 2011, MNRAS, 412, 2498 [NASA ADS] [CrossRef] [Google Scholar]
- Makarov, D. I., & Uklein, R. I. 2012, Astrophys. Bull., 67, 135 [Google Scholar]
- Makarov, D., Prugniel, P., Terekhova, N., Courtois, H., & Vauglin, I. 2014, A&A, 570, A13 [NASA ADS] [CrossRef] [EDP Sciences] [Google Scholar]
- Mei, S., Blakeslee, J. P., Côté, P., et al. 2007, ApJ, 655, 144 [Google Scholar]
- Mould, J. R., Huchra, J. P., Freedman, W. L., et al. 2000, ApJ, 529, 786 [Google Scholar]
- Paturel, G., Petit, C., Prugniel, P., et al. 2003, A&A, 412, 45 [NASA ADS] [CrossRef] [EDP Sciences] [Google Scholar]
- Popesso, P., Biviano, A., Böhringer, H., & Romaniello, M. 2006, A&A, 445, 29 [NASA ADS] [CrossRef] [EDP Sciences] [Google Scholar]
- Raj, M. A., Awad, P., Peletier, R. F., et al. 2024, A&A, 690, A92 [NASA ADS] [CrossRef] [EDP Sciences] [Google Scholar]
- Roberts, S., Davies, J., Sabatini, S., et al. 2004, MNRAS, 352, 478 [Google Scholar]
- Roediger, J. C., & Courteau, S. 2015, MNRAS, 452, 3209 [NASA ADS] [CrossRef] [Google Scholar]
- Rude, C. M., Sultanova, M. R., Kaduwa Gamage, G. L. I., Barkhouse, W. A., & Kalawila Vithanage, S. P. 2020, MNRAS, 493, 5625 [NASA ADS] [CrossRef] [Google Scholar]
- Sabatini, S., Davies, J., Scaramella, R., et al. 2003, MNRAS, 341, 981 [NASA ADS] [CrossRef] [Google Scholar]
- Sabatini, S., Davies, J., van Driel, W., et al. 2005, MNRAS, 357, 819 [Google Scholar]
- Sánchez-Janssen, R., Aguerri, J. A. L., & Muñoz-Tuñón, C. 2008, ApJ, 679, L77 [CrossRef] [Google Scholar]
- Steer, I., Madore, B. F., Mazzarella, J. M., et al. 2017, AJ, 153, 37 [Google Scholar]
- Stierwalt, S., Liss, S. E., Johnson, K. E., et al. 2017, Nat. Astron., 1, 0025 [CrossRef] [Google Scholar]
- Trujillo, I., Aguerri, J. A. L., Gutiérrez, C. M., Caon, N., & Cepa, J. 2002, ApJ, 573, L9 [Google Scholar]
- Urban, O., Werner, N., Simionescu, A., Allen, S. W., & Böhringer, H. 2011, MNRAS, 414, 2101 [NASA ADS] [CrossRef] [Google Scholar]
- Zakharova, D., Vulcani, B., De Lucia, G., et al. 2024, A&A, 690, A300 [NASA ADS] [CrossRef] [EDP Sciences] [Google Scholar]
R200 corresponds the radius within which the mean density is 200 times the critical density of the Universe.
The cut in the absolute magnitude (Mr = −19 mag) also assumes that all galaxies are at the same distance from the Virgo cluster. For example, the selection for dwarf and giant galaxies using the EVCC catalogue corresponds to a limit in stellar mass of log(M*) ∼ 9.3 M⊙ following the colour-mass-to-light ratio defined in Roediger & Courteau (2015), assuming that all galaxies are at the same distance as the Virgo cluster (m − M = 31.09 mag, Mei et al. 2007).
We did not count galaxies between −21 and −22 mag to avoid possible contamination with our selection of dwarf and giant galaxies. We performed a preliminary test by cross-matching galaxies previously classified as dwarfs and giants based on r-band photometry with K-band data. This revealed a minor overlap of galaxies within the specified K-band range.
The R200 radius used in this analysis corresponds to 3.9 deg. (Arnaud et al. 2005; Urban et al. 2011).
We also checked whether the DF measured changes when no magnitude limit is applied to the catalogue. The DF values change a bit, but the variations in different locations of RA and Dec are qualitatively similar as seen in Fig. 3. The same analysis was performed for the other catalogues NSA-Castignani and Makarov/Hyperleda (Figs. 4 and 5), and the trend of DF remains similar when using the entire range of magnitudes of the catalogue.
One caveat to note is that the local number of galaxies (Ng + Nd) using this K-band catalogue may not represent the total population, since objects within the range −22 < K < −21 mag have been discarded, as explained in Sect. 2. However, we emphasise that our goal here is not to quantitatively compare these findings with results from other catalogues where r-band selection was used.
The galaxies belonging to this region are selected as those not belonging to the filamentary structure or the ones detected in the cluster area.
Appendix A: DF locally measured with Cartesian Supergalactic Coordinates
In Figure 4, we measured the local DF in regions enclosing fifteen near neighbours. The distances to identify these neighbors were calculated in 2D using projected RA and Dec coordinates. Additionally, here as a check, we perform the same analysis but in supergalactic coordinates. In Figure A.1, we measure the local DF similarly to the equatorial coordinates, but the distances were calculated using 3D Cartesian Supergalactic Coordinates (SGX, SGY, SGZ). We also used a cosmic velocity model measured in Castignani et al. (2022b) for the calculation of these coordinates to account for the effect of attractors in the local universe (Mould et al. 2000). Qualitatively, this figure and Fig. 4 are similar. We also did a quantitative comparison between them, this is, comparing the DF value galaxy to galaxy. We find that the difference is small for most of the galaxies (∼80 %) in the sample having a difference ≤ 0.08 (within 1σ) of the distribution as can be seen in Fig. A.2.
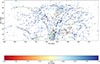 |
Fig. A.1. Similar to Fig. 4. Projected spatial distribution of galaxies in the large-scale structure around Virgo (NSA-Castignani catalogue), but calculated using Cartesian Supergalactic Coordinates (SGX, SGY, SGZ). |
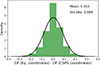 |
Fig. A.2. Difference between the DF measured on each galaxy with 2D coordinate system and with the Cartesian supergalactic coordinates. Black line highlights a Gaussian distribution. |
Appendix B: Distribution of galaxies with high and low DF
In the top panel of Fig. B.1 we show the projected spatial distribution of galaxies with a very high DF (≥ 0.95, regions mainly populated by dwarfs) selected from Fig. 4. Similarly, in the bottom panel we show the distribution of those galaxies with a low DF (≤ 0.75, region populated by a relatively high concentration of giants - at least 25% of them are giant galaxies in that neighbourhood-). From this figure we can see that dwarf galaxies are widely distributed in all environments with a predominance in less dense environments as compared to the bright giant galaxies.
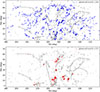 |
Fig. B.1. Distribution of galaxies with a DF ≥ 0.95 (top panel) and with a DF ≤ 0.75 (bottom panel). |
Appendix C: DF in different environments: comparison with filamentary structure detected with 1-DREAM
We also examine the dwarf fraction distribution found in Fig. 6 for the filamentary structure that we detect with LAAT/1-DREAM (1-Dimensional Recovery, Extraction, and Analysis of Manifolds Canducci et al. 2022). 1-DREAM is a toolbox composed of five algorithms ranging from the detection of filaments to the finding of their central spines (see also Awad et al. 2024; Raj et al. 2024). For the purpose of this analysis, we only make use of one of its algorithms; the Locally Aligned Ant Technique (LAAT). LAAT uses the principle of the ant colony methodology and thus aims to identify and highlight 1-D structures via the local value of the pheromone count. Using a threshold in this parameter, we can filter out noise surrounding the filaments. We run LAAT/1-DREAM on the NSA and Makarov & Karachentsev (2011) catalogues and did several tests, we tried varying the two main parameters of the algorithm, the neighbourhood radius and the pheromone cut. For example, a lower pheromone cut gives less noise removal, and larger radius links up structures with gaps that are more extended. We noticed that the DF results were not strongly affected by the exact choice of parameters. We used the right ascension, declination, and redshift information from the catalogues as input parameters, and selected then a minimum pheromone cut of 0.1 from the output data. Thus, in Fig. C.1 we show the DF distribution for the NSA-Castignani catalogue using the filaments extracted by 1-DREAM (green box). As can be noted, the DF distribution is similar when using 1-DREAM and the filament catalogue from Castignani (e.g., the median DF value ∼ 0.9 for the filamentary region). Additionally, in the bottom panel of the figure we did the same analysis where we exclude and include only the group galaxies, but this time using the group catalogue of Makarov & Karachentsev (2011). As can be noticed, the result remains similar to when we use the Kourkchi & Tully (2017) group catalogue.
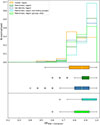 |
Fig. C.1. DF distribution in different environments using the NSA-Castignani galaxy catalogue using the filamentary structure detected by 1-DREAM. Top panel: Distribution of DF values in the Virgo cluster region (orange), filamentary region (green), and low-density regions (blue). Additionally, we include the DF distribution of the filamentary region excluding galaxies belonging to groups (from Makarov & Karachentsev (2011) group catalogue; cyan) and vice versa, including only galaxies belonging to groups (lime). |
All Tables
Number of dwarf and giant galaxies in the EVCC catalogue (up to an absolute magnitude, Mr = −14 mag).
All Figures
|
Fig. 1. Absolute magnitude range of galaxies in the EVCC (r band, left panel), NSA-Castignani (r band, middle panel), and Hyperleda (K band, right panel) catalogues. The dashed red line indicates the threshold limit that we used to separate giant (left side) from dwarf (right side) galaxies in the EVCC and NSA catalogues. The rightmost dashed blue line marks the limit imposed on dwarf galaxies to ensure the completeness of magnitudes of each catalogue. The blue dashed lines in the third panel indicates the Mk range to select dwarf galaxies in the Hyperleda catalogue. We note that absolute magnitudes are measured at the distance of Virgo. |
| In the text | |
|
Fig. 2. Left panel: Projected spatial distribution of dwarfs (blue open symbols) and giants (red filled symbols) from the EVCC catalogue. The black cross indicates the position of M87. The dashed circle indicates the R200 region of the Virgo cluster. Middle panel: Cumulative distributions of cluster-centric distance of giant and dwarf galaxies inside R200 of Virgo cluster. We note that in both panels the galaxy distribution is limited to Mr = −14 mag. Right panel: Dwarf fraction (DF, measured in bins of distance) as a function of projected cluster-centric distance, measured for the EVCC catalogue without magnitude threshold (dashed line) and for galaxies up to an absolute magnitude, Mr = −14 mag (filled line). |
| In the text | |
|
Fig. 3. Galaxy spatial distribution in EVCC area. The red circle highlights the R200 radius of the Virgo cluster. Left: DF in cluster region. Right: DF in entire field of view of EVCC catalogue. The grey circles highlight the groups from the galaxy group catalogue of Kourkchi & Tully (2017). The northern grey lines highlight the filaments of the Castignani et al. (2022b) catalogue. The two filaments in the south were extracted from Fig. 2 of Castignani et al. (2022a). The colour bar in each panel denotes the DF associated with each galaxy, as quantified by considering its 15 nearest neighbours. |
| In the text | |
|
Fig. 4. Galaxy spatial projected distribution in large-scale structure around Virgo (northern hemisphere) from the NSA-Castignani catalogue (Castignani et al. 2022b). Colour indicates the local DF measured for each galaxy in the region enclosing its 15 near-neighbour galaxies. The red circle highlights the R200 radius of the Virgo cluster, while grey circles highlight the (loose and rich) groups from the galaxy group catalogue of Kourkchi & Tully (2017, in the velocity range 500 < vr < 3300 km s−1; the circle sizes correspond to the projected virial radius of the groups described in that work). The grey lines highlight the filaments of the Castignani et al. (2022a,b) catalogue: Leo Minor F, Canes Venatici F, Bootes F, Ursa Major Cloud, Leo II B F, Leo II A F, Virgo III F, Leo Minor B F, W–M Sheet, NGC 5353/4 F, Serpens F, Draco F, and Coma Berenices F. |
| In the text | |
|
Fig. 5. Galaxy spatial projected distribution in large-scale structure around Virgo (including the southern hemisphere) from the Hyperleda catalogue described in Makarov & Karachentsev (2011). Colour indicates the DF of each galaxy measured in the region containing the 15 near-neighbour galaxies. The red circle highlights the Virgo cluster, while grey circles highlight the (loose and rich) groups from the galaxy group catalogue of Kourkchi & Tully (2017, in the velocity range 500 < vr < 3300 km s−1). The grey lines highlight the filaments of the Castignani et al. (2022b) catalogue. We note that all the filaments reported in Castignani et al. (2022b) are plotted in the figure: Leo Minor F, Canes Venatici F, Bootes F, Ursa Major Cloud, Leo II B F, Leo II A F, Virgo III F, Leo Minor B F, W–M Sheet, NGC 5353/4 F, Serpens F, Draco F, and Coma Berenices F. The two filaments in the south: Virgo Southern Extension and Crater were extracted from Castignani et al. (2022a, see their Fig. 2). |
| In the text | |
|
Fig. 6. DF distribution in different environments using NSA-Castignani catalogue (left) and Hyperleda catalogue (north hemisphere; right). Top panel: Distribution of DF values in Virgo-cluster region (orange), filamentary region (green), and low-density regions (blue). Additionally, we include the DF distribution of the filamentary region excluding galaxies belonging to groups (cyan) and vice versa, only including galaxies belonging to groups (lime). Bottom panels: Box plots of same distributions. We note that the box covers the first and third quartile of the data (e.g. between the 25th and 75th percentiles), while the line above it indicates the median value. The whiskers indicate the lowest and highest values still within 1.5 times the interquartile range, and the open dot symbols mark the outliers. |
| In the text | |
|
Fig. A.1. Similar to Fig. 4. Projected spatial distribution of galaxies in the large-scale structure around Virgo (NSA-Castignani catalogue), but calculated using Cartesian Supergalactic Coordinates (SGX, SGY, SGZ). |
| In the text | |
|
Fig. A.2. Difference between the DF measured on each galaxy with 2D coordinate system and with the Cartesian supergalactic coordinates. Black line highlights a Gaussian distribution. |
| In the text | |
|
Fig. B.1. Distribution of galaxies with a DF ≥ 0.95 (top panel) and with a DF ≤ 0.75 (bottom panel). |
| In the text | |
|
Fig. C.1. DF distribution in different environments using the NSA-Castignani galaxy catalogue using the filamentary structure detected by 1-DREAM. Top panel: Distribution of DF values in the Virgo cluster region (orange), filamentary region (green), and low-density regions (blue). Additionally, we include the DF distribution of the filamentary region excluding galaxies belonging to groups (from Makarov & Karachentsev (2011) group catalogue; cyan) and vice versa, including only galaxies belonging to groups (lime). |
| In the text | |
Current usage metrics show cumulative count of Article Views (full-text article views including HTML views, PDF and ePub downloads, according to the available data) and Abstracts Views on Vision4Press platform.
Data correspond to usage on the plateform after 2015. The current usage metrics is available 48-96 hours after online publication and is updated daily on week days.
Initial download of the metrics may take a while.