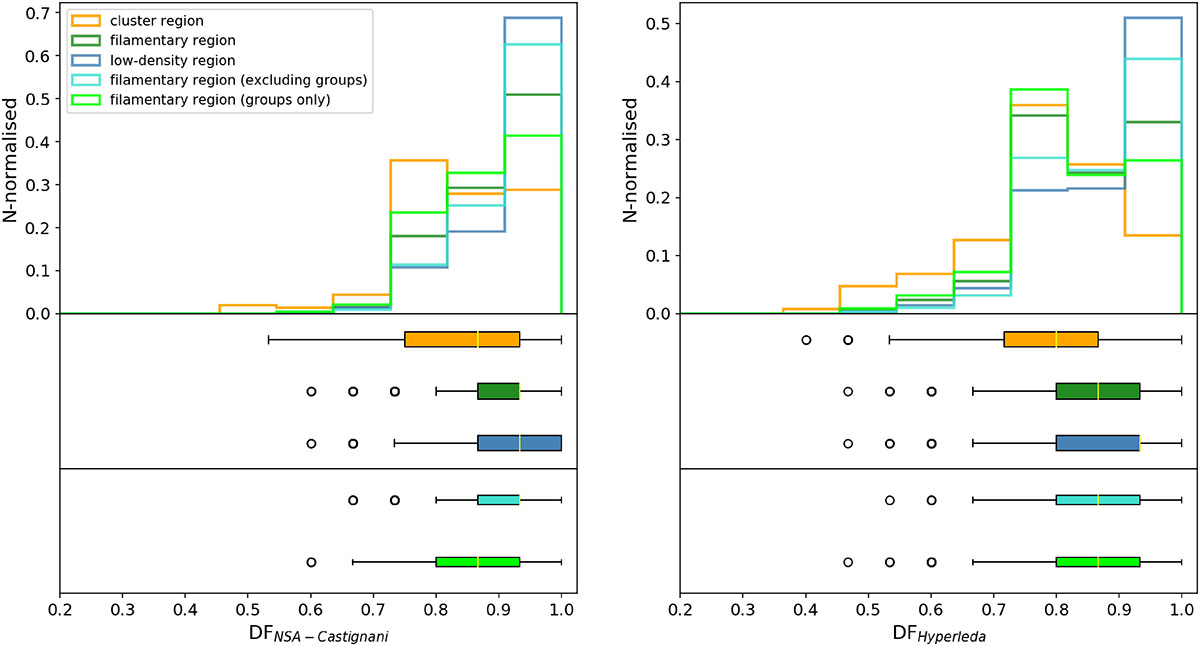
Fig. 6.
Download original image
DF distribution in different environments using NSA-Castignani catalogue (left) and Hyperleda catalogue (north hemisphere; right). Top panel: Distribution of DF values in Virgo-cluster region (orange), filamentary region (green), and low-density regions (blue). Additionally, we include the DF distribution of the filamentary region excluding galaxies belonging to groups (cyan) and vice versa, only including galaxies belonging to groups (lime). Bottom panels: Box plots of same distributions. We note that the box covers the first and third quartile of the data (e.g. between the 25th and 75th percentiles), while the line above it indicates the median value. The whiskers indicate the lowest and highest values still within 1.5 times the interquartile range, and the open dot symbols mark the outliers.
Current usage metrics show cumulative count of Article Views (full-text article views including HTML views, PDF and ePub downloads, according to the available data) and Abstracts Views on Vision4Press platform.
Data correspond to usage on the plateform after 2015. The current usage metrics is available 48-96 hours after online publication and is updated daily on week days.
Initial download of the metrics may take a while.