Fig. 10.
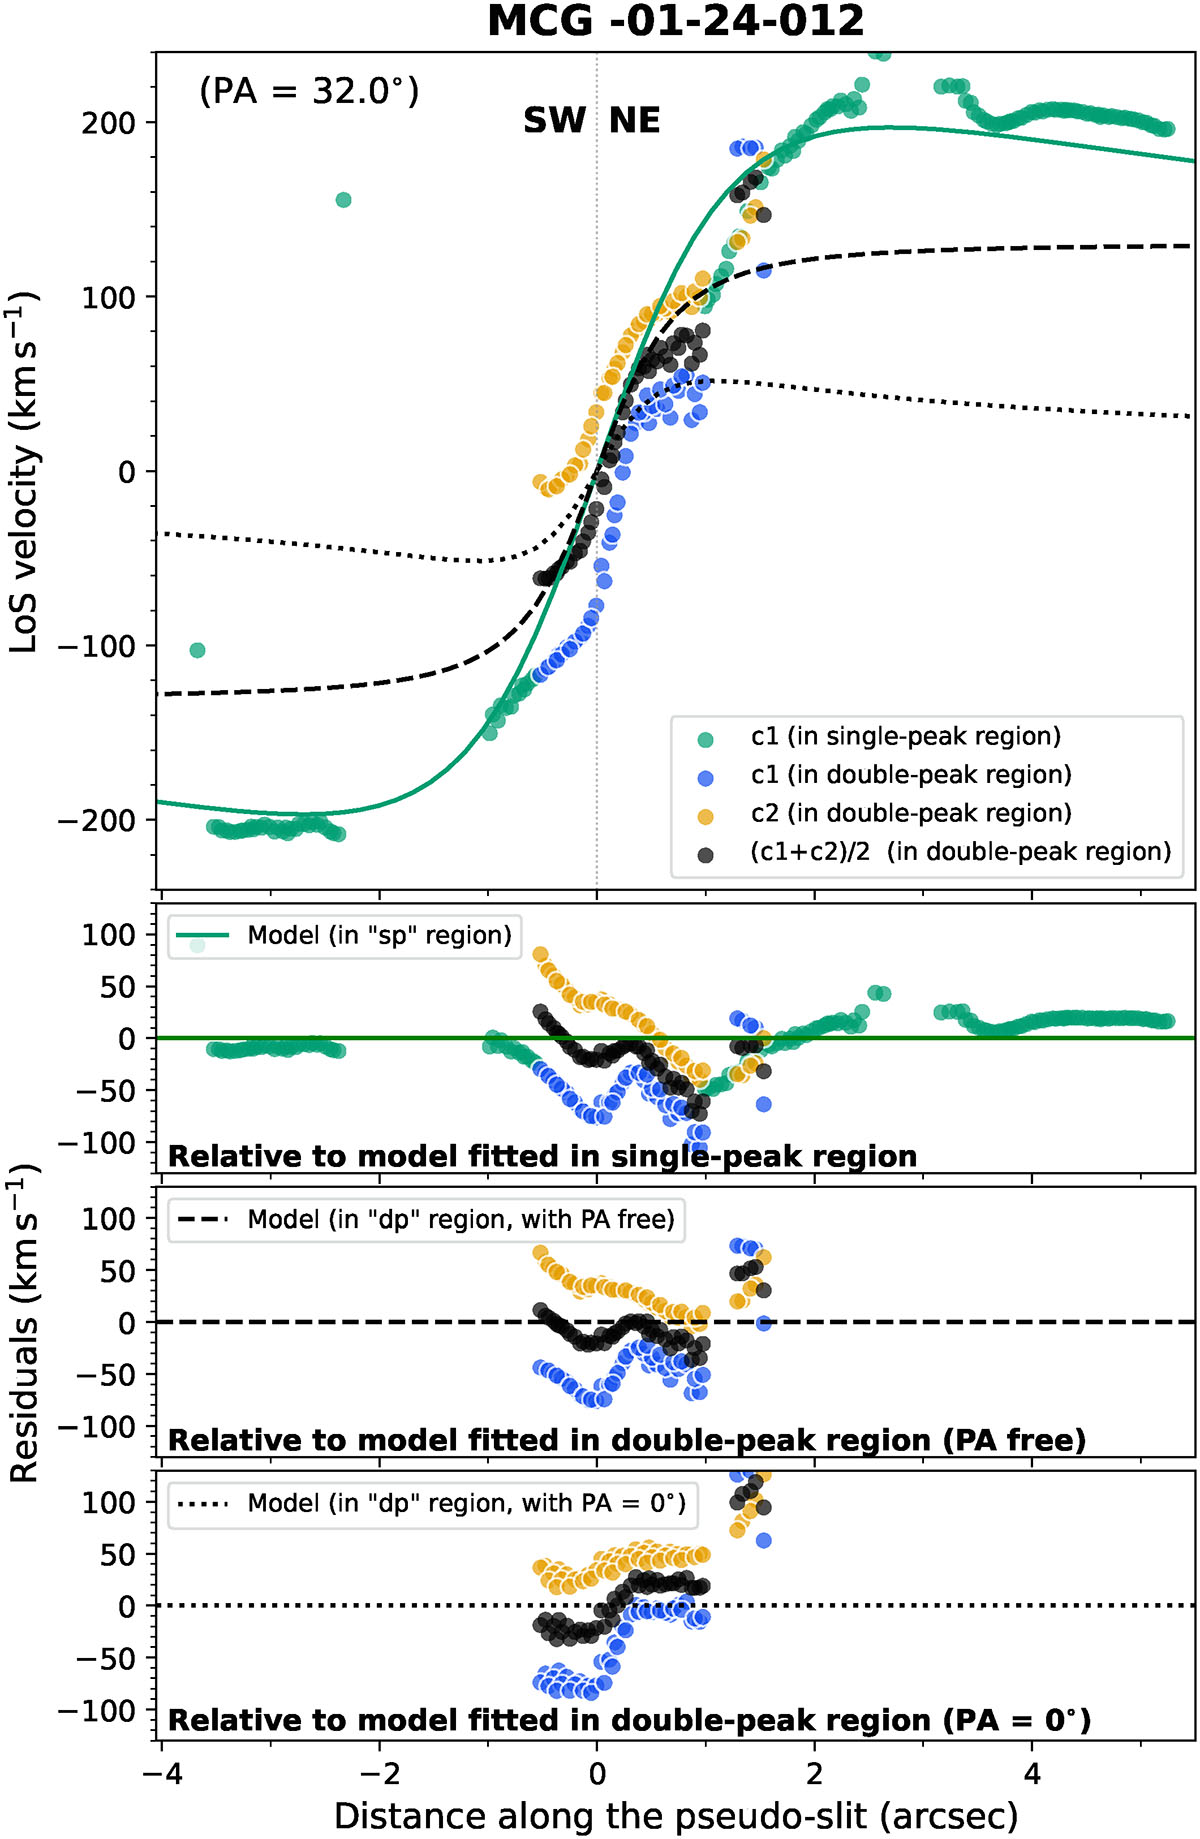
Download original image
Distribution of the LOS velocity versus the distance along the global kinematic major axis (PA = 32.0°, inside a 0.27″ slit width) of MCG -01-24-012. Values in the single-peak region are shown as blueish-green circles (component c1), while values in the double-peak region are shown as blue (for c1) and orange circles (for c2). The black circles correspond to the average between the LoS velocities of both components (vrot, CND). In the top row, along with the LoS velocity values of each component, we show lines representing models fit to the data. The global disk model, obtained in the single-peak region (see Fig. 7), is shown as a blueish-green line, with the residual shown in the second row. We show two models fit in the CND region (see maps in Fig. F.2, and schematic models in Fig. 11): one with the a free PA parameter (black dashed line, with the residuals in the third row); and another with PA = 0° fixed (black dotted line, with the residuals in the forth row).
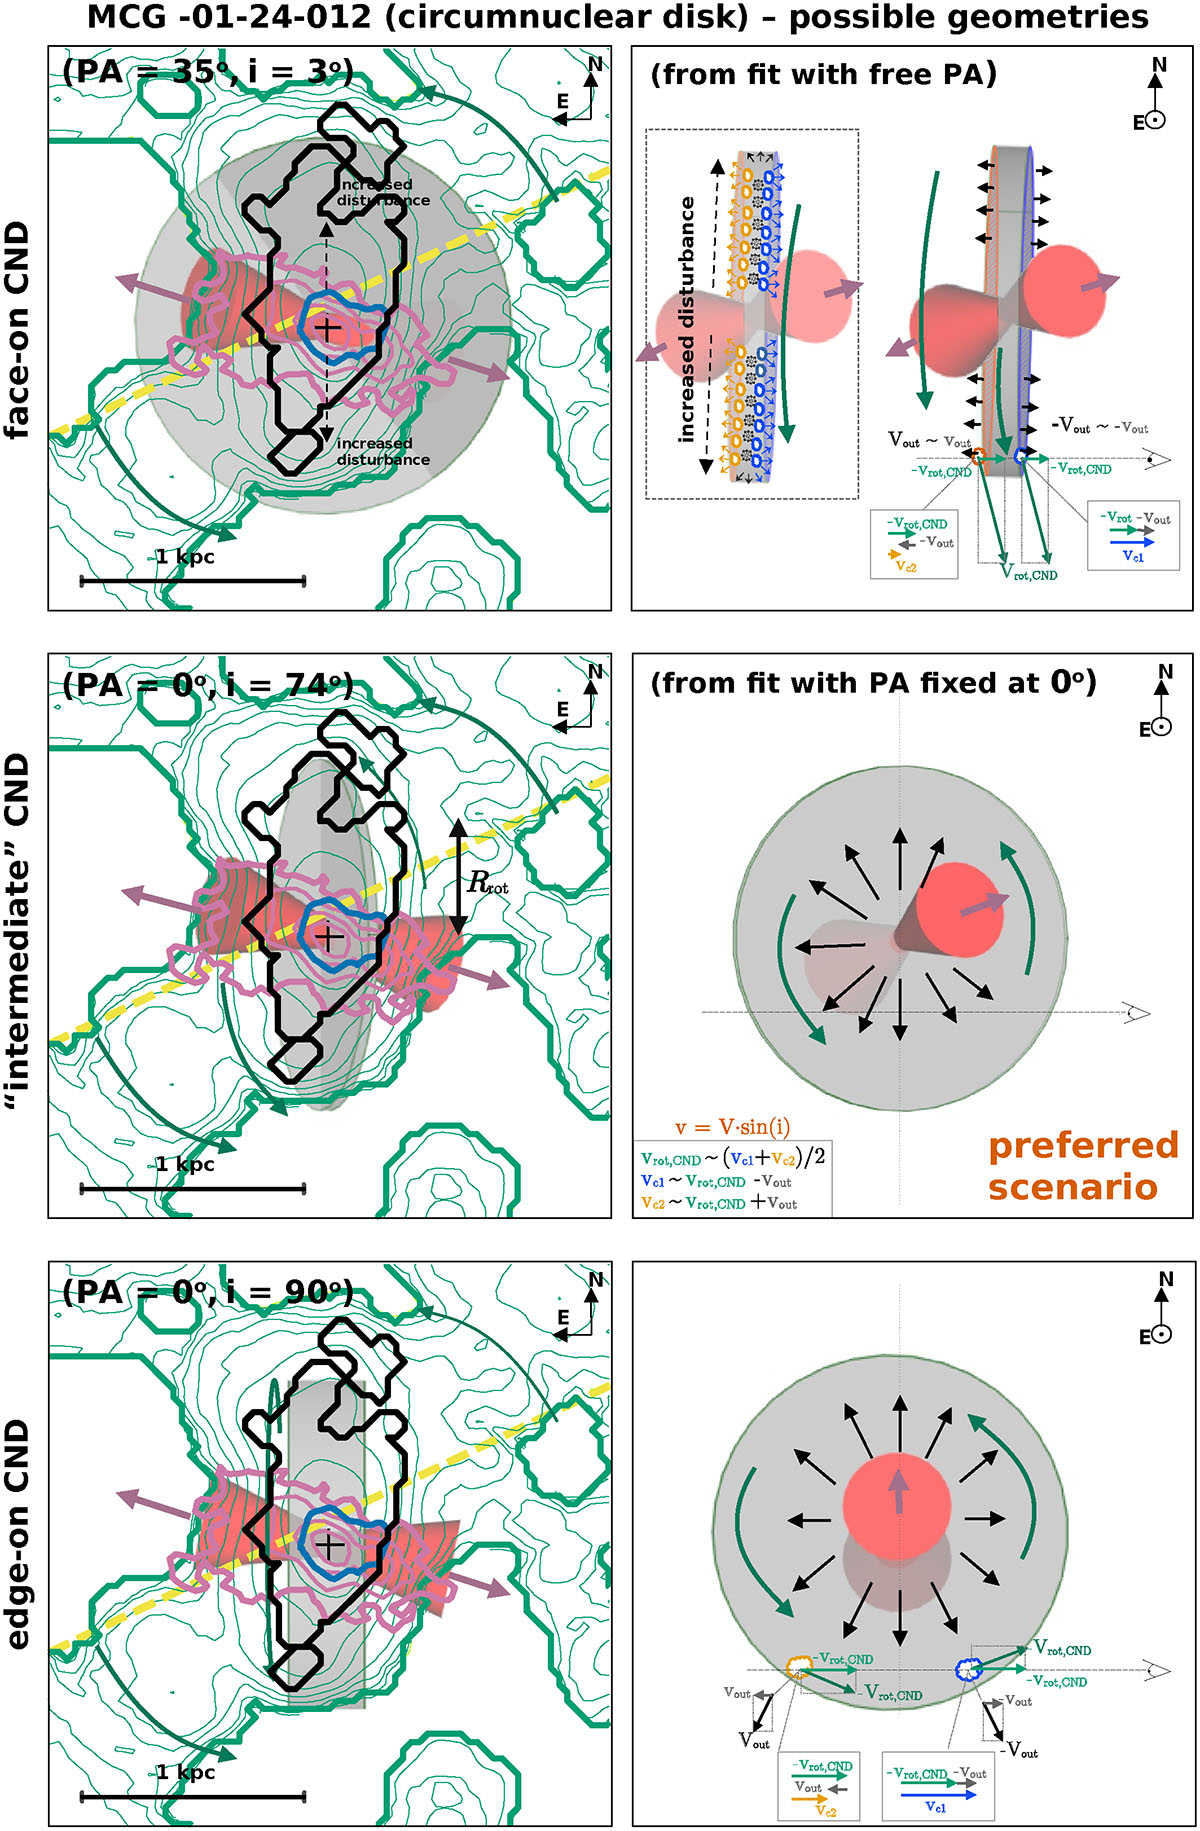
Fig. 11.
Possible geometries for the CND in MCG -01-24-012. The legend from Fig. 8 also applies here. The left and right columns show the observation and lateral views, respectively. On the right, we added arrows to represent the velocity vectors of the components c1 (blue) and c2 (orange), decomposed in the rotating (bluish-green) and outflowing (black) parts, with diagrams. As in Fig. 8, the orientations of the ionized cones were chosen to try to reproduce the [O III] emission (reddish-purple contours). In the first row, the face-on CND is the result of fitting a rotating disk model with free PA. In this scenario, the CO double peaks would result from expanding clouds perpendicular to the disk. In the last row, we show another way of reproducing the double peaks by assuming an edge-on disk geometry, with the outflow occurring radially along the disk. Our preferred scenario lies between these two geometries, as shown in the middle row. This model is the result of fixing PA at 0° to reproduce the CO flux distribution, which yields an inclination of 74°.

Current usage metrics show cumulative count of Article Views (full-text article views including HTML views, PDF and ePub downloads, according to the available data) and Abstracts Views on Vision4Press platform.
Data correspond to usage on the plateform after 2015. The current usage metrics is available 48-96 hours after online publication and is updated daily on week days.
Initial download of the metrics may take a while.