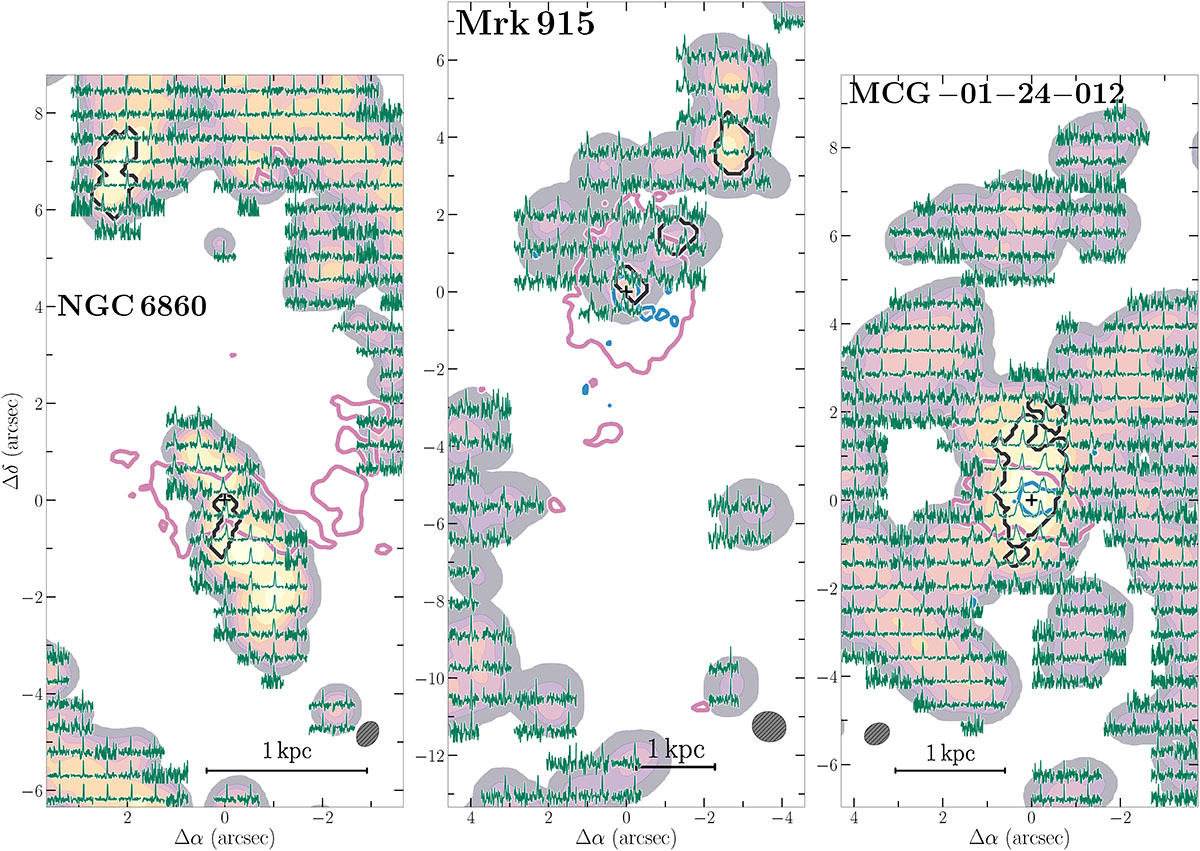
Fig. A.1.
Download original image
Grid of the spectra showing the spatial variation of CO(2-1) emission-line profiles of NGC 6860, Mrk 915, and MCG-01-24-012. Each grid spectrum is the sum of all individual spectra inside a region equivalent to the observation beam (gray ellipses). All spectra are normalized for better visualization. The velocity range of the profiles is (-400, 400) km s−1. For reference, the CO flux distribution is shown in the translucent colormap. Overlaid are outer contours from the VLA 3.6 cm radio (in blue) and the smoothed HST [O III] emission (in reddish-purple). We note that the measurements presented on Tables 3 and 4 were calculated from individual spaxels, and not from the integrated spectra presented in these grids.
Current usage metrics show cumulative count of Article Views (full-text article views including HTML views, PDF and ePub downloads, according to the available data) and Abstracts Views on Vision4Press platform.
Data correspond to usage on the plateform after 2015. The current usage metrics is available 48-96 hours after online publication and is updated daily on week days.
Initial download of the metrics may take a while.