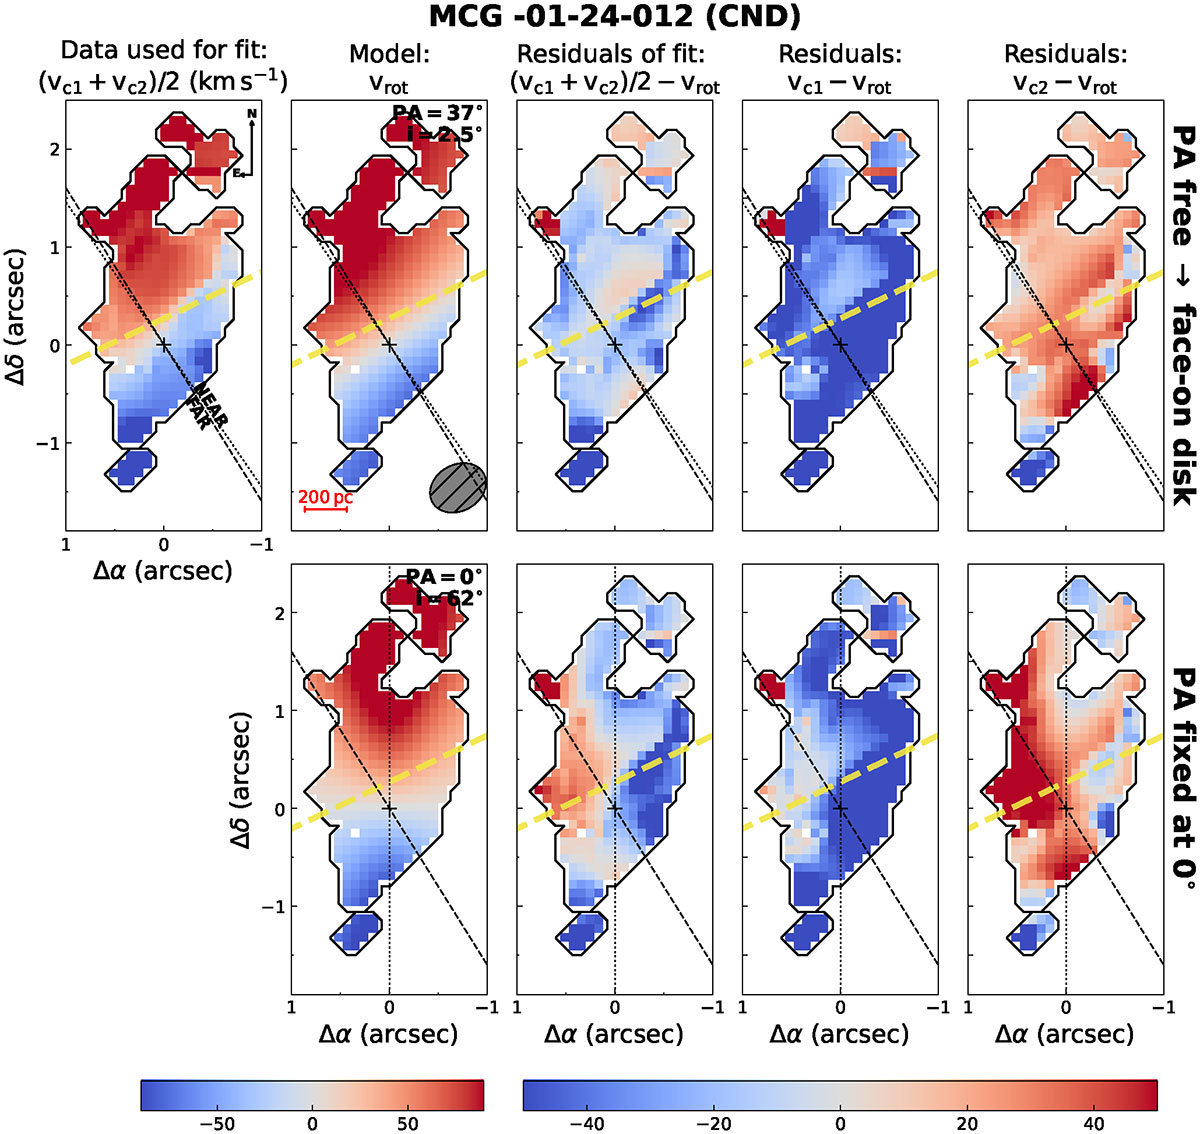
Fig. F.2.
Download original image
Similar to Fig. 7 but for the fit done in the region with double-peak profiles of MCG -01-24-012 to model the CND rotation. In the first row, the PA parameter was set free during the fit, which resulted in a face-on disk, while in the second row, we fixed PA at 0°, resulting in a more inclined disk. The data used to fit the disk model corresponds to the average between the LoS velocities of the components c1 and c2 in the double-peak region (black contours). The first three columns show the LoS velocity data, the best-fit rotation model, and the residuals of the fit data. The last two columns correspond to the residuals of each component. The dotted and dashed black lines are the kinematic major axes of the CND models and the global model (Fig. 7). The orange dashed line indicates the position of the stellar bar.
Current usage metrics show cumulative count of Article Views (full-text article views including HTML views, PDF and ePub downloads, according to the available data) and Abstracts Views on Vision4Press platform.
Data correspond to usage on the plateform after 2015. The current usage metrics is available 48-96 hours after online publication and is updated daily on week days.
Initial download of the metrics may take a while.