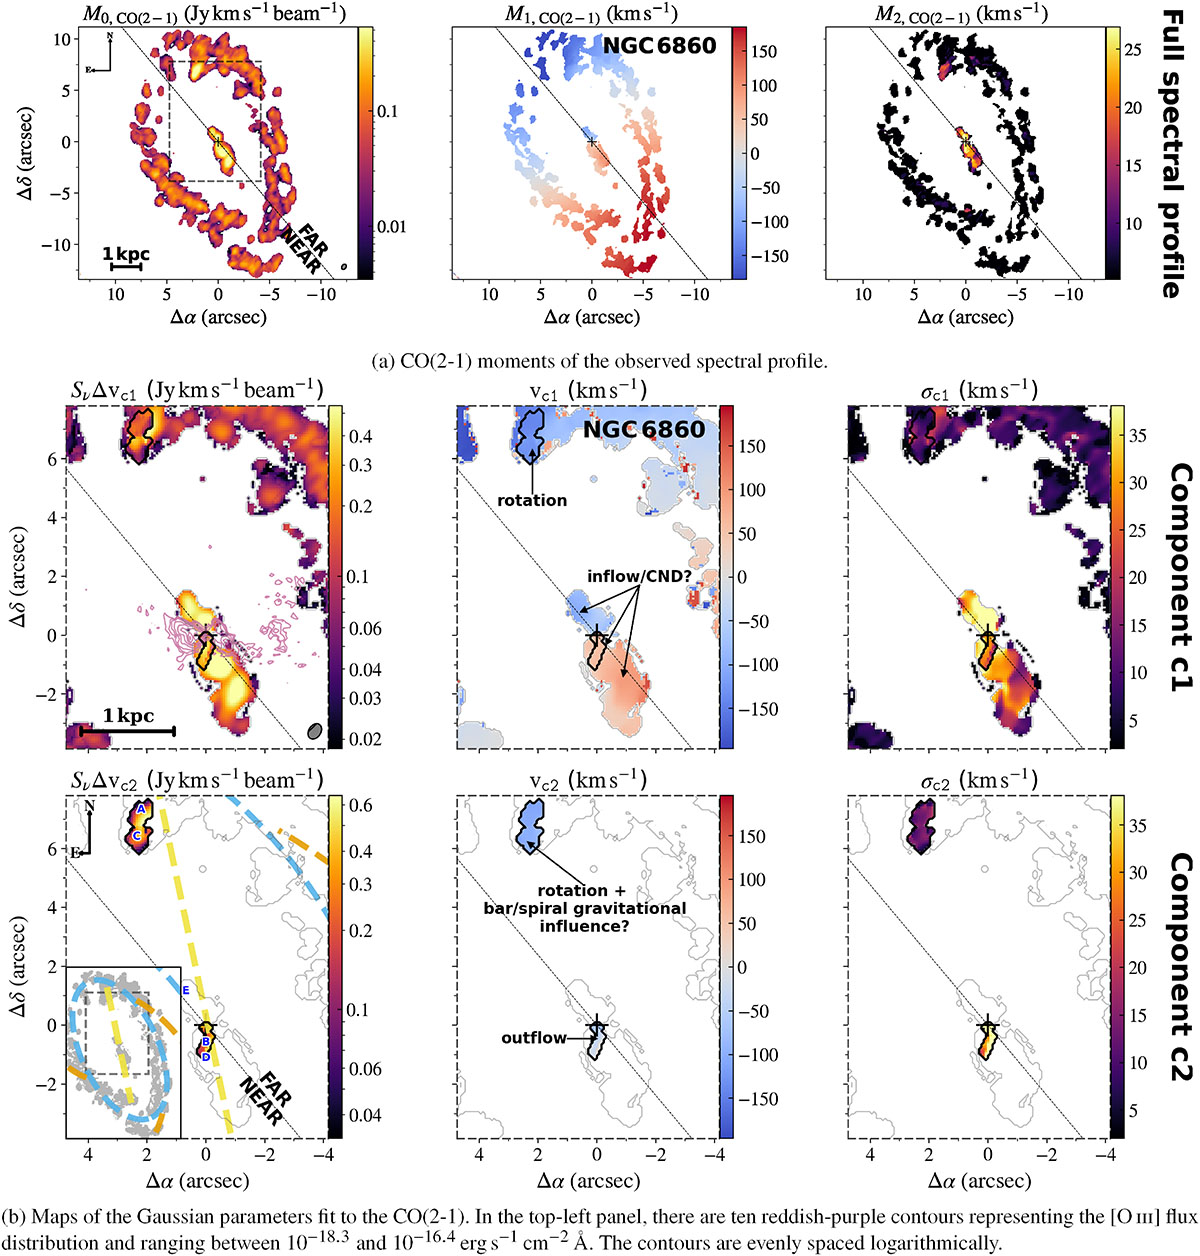
Fig. 2.
Download original image
Maps of NGC 6860. (a) Spatial distributions of the CO(2-1) moments maps of the observed spectral profile, with M0 corresponding to the integrated flux, M1 tracing the mean radial velocity, and M2 representing the velocity dispersion of the CO profile. (b) Maps of the parameters of the two Gaussian components fit the CO(2-1) profiles: c1 (top row) and c2 (bottom row). The columns correspond to distributions of the flux (left), the LoS velocity (middle), and the velocity dispersion (right). In the bottom row, contours outline the full CO(2-1) extent (in gray) and the double-peak region (in black). In the bottom-left map, we added dashed lines representing the spiral arms (orange), the stellar bar (yellow), and the ring (sky-blue), as identified in Paper I. The letters A – E in the lower-left panel show the locations of the spaxels used as examples of fits in Fig. 5. For this and all other maps in the paper: North is up and east is left. The coordinates are relative to ALMA millimeter continuum peak (black cross marks, see Table 1), assumed to be to the galactic nucleus. The gray ellipses correspond to the ALMA beam size of the observation. The inclined black dotted line is the major axis of the global kinematic model.
Current usage metrics show cumulative count of Article Views (full-text article views including HTML views, PDF and ePub downloads, according to the available data) and Abstracts Views on Vision4Press platform.
Data correspond to usage on the plateform after 2015. The current usage metrics is available 48-96 hours after online publication and is updated daily on week days.
Initial download of the metrics may take a while.