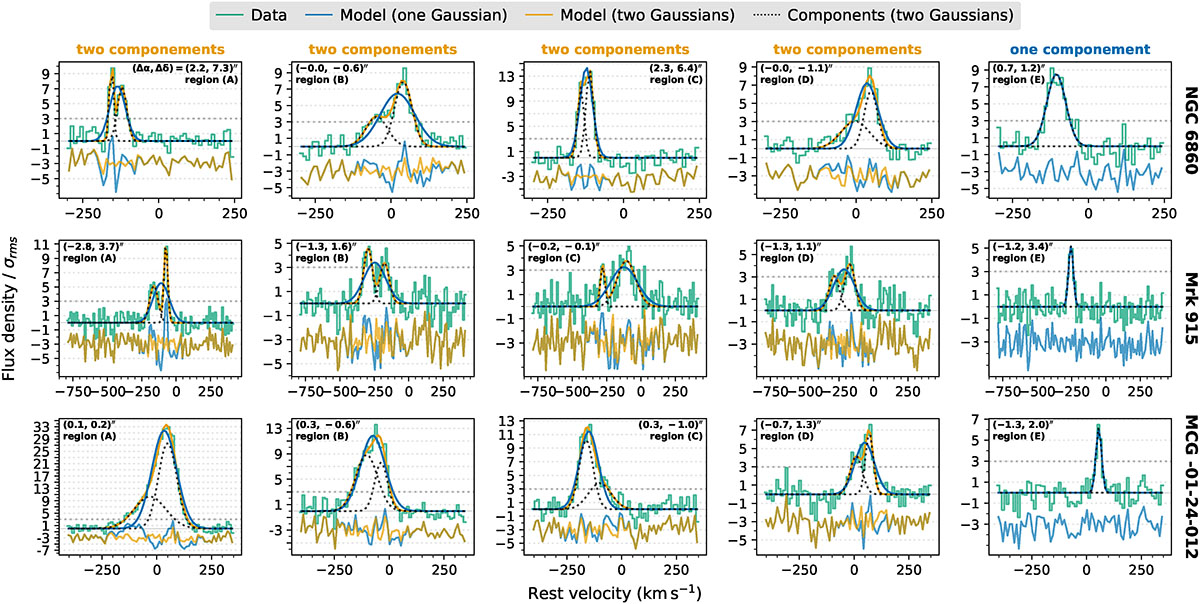
Fig. 5.
Download original image
Example of the model multiple Gaussian models fit to the CO(2-1) profiles of individual spaxels (0.076–0.16″ sizes), one row per object. The first four columns (A to D) show examples where two Gaussian components were preferred over a single component, as in the last column (E). The spatial positions (relative to the nucleus) of each spaxel are shown at the top of each panel and are marked in Figs. 2a, 3a and 4a (blue letters in the lower left panels). The lines represent: original data (bluish-green); one Gaussian component models (in blue); two Gaussian models (in orange), along with their individual components (in black dashed). The residuals of both models are shifted downward in the plots. The y-axes are in units of S/N. The horizontal dotted line corresponds to S/N = 3 and is highlighted since this was the threshold used to discard components.
Current usage metrics show cumulative count of Article Views (full-text article views including HTML views, PDF and ePub downloads, according to the available data) and Abstracts Views on Vision4Press platform.
Data correspond to usage on the plateform after 2015. The current usage metrics is available 48-96 hours after online publication and is updated daily on week days.
Initial download of the metrics may take a while.