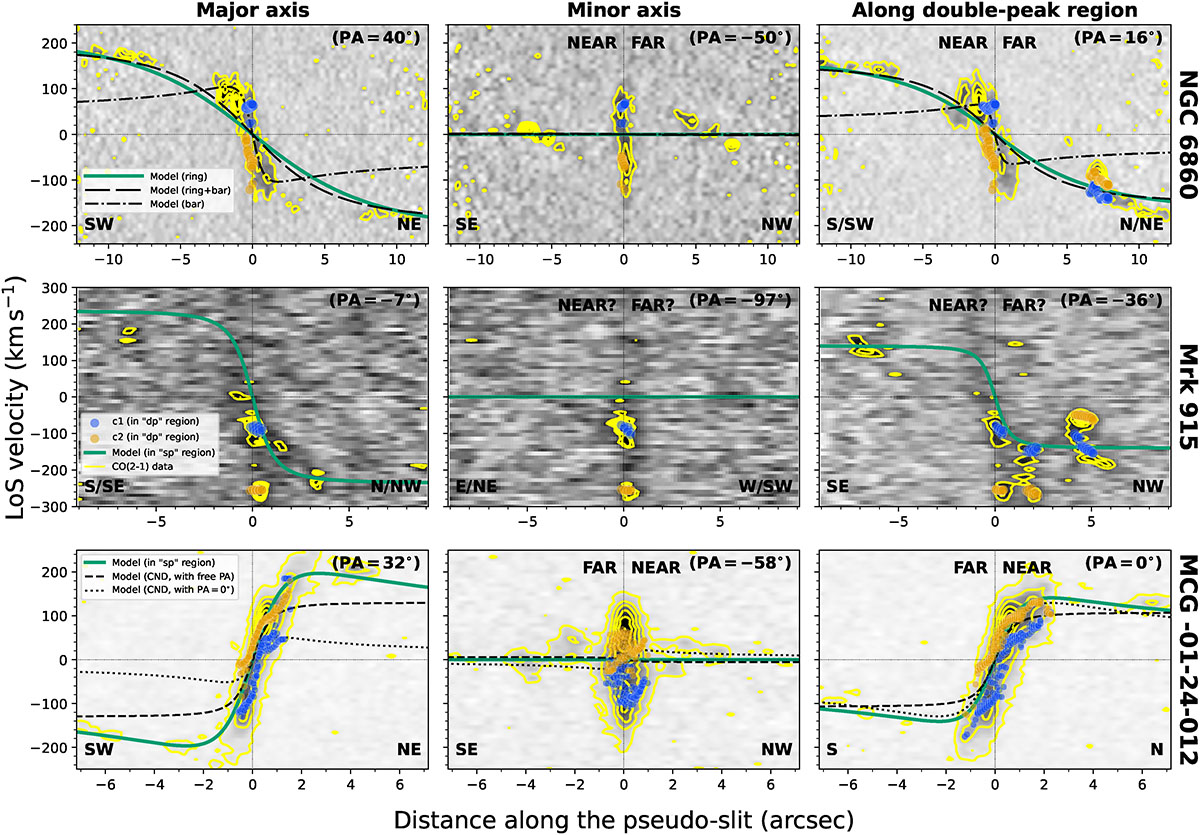
Fig. 6.
Download original image
Position-velocity maps for the CO(2-1) of each object for 1″-width pseudo-slits along three different positions: kinematics major and minor axis (first two columns) and along the double-peak (dp) region (last column). We added the individual LoS velocities obtained for the Gaussian components c1 (blue circles) and c2 (orange circles) fit to the spectral profiles. The bluish-green lines correspond to the global rotating disk model fit to the single-peak (sp) region (first three rows in Table 2). For NGC 6860, three models are shown, which were fit using data from the ring (bluish-green line), from the bar (dot-dashed black line), and combining data from both ring and bar (long dashed black line). For MCG -01-24-012, we also added curves from two models fit in the double-peak region, one letting the PA free (short dashed black line) and the other with PA = 0° (dotted black line).
Current usage metrics show cumulative count of Article Views (full-text article views including HTML views, PDF and ePub downloads, according to the available data) and Abstracts Views on Vision4Press platform.
Data correspond to usage on the plateform after 2015. The current usage metrics is available 48-96 hours after online publication and is updated daily on week days.
Initial download of the metrics may take a while.