Fig. 7.
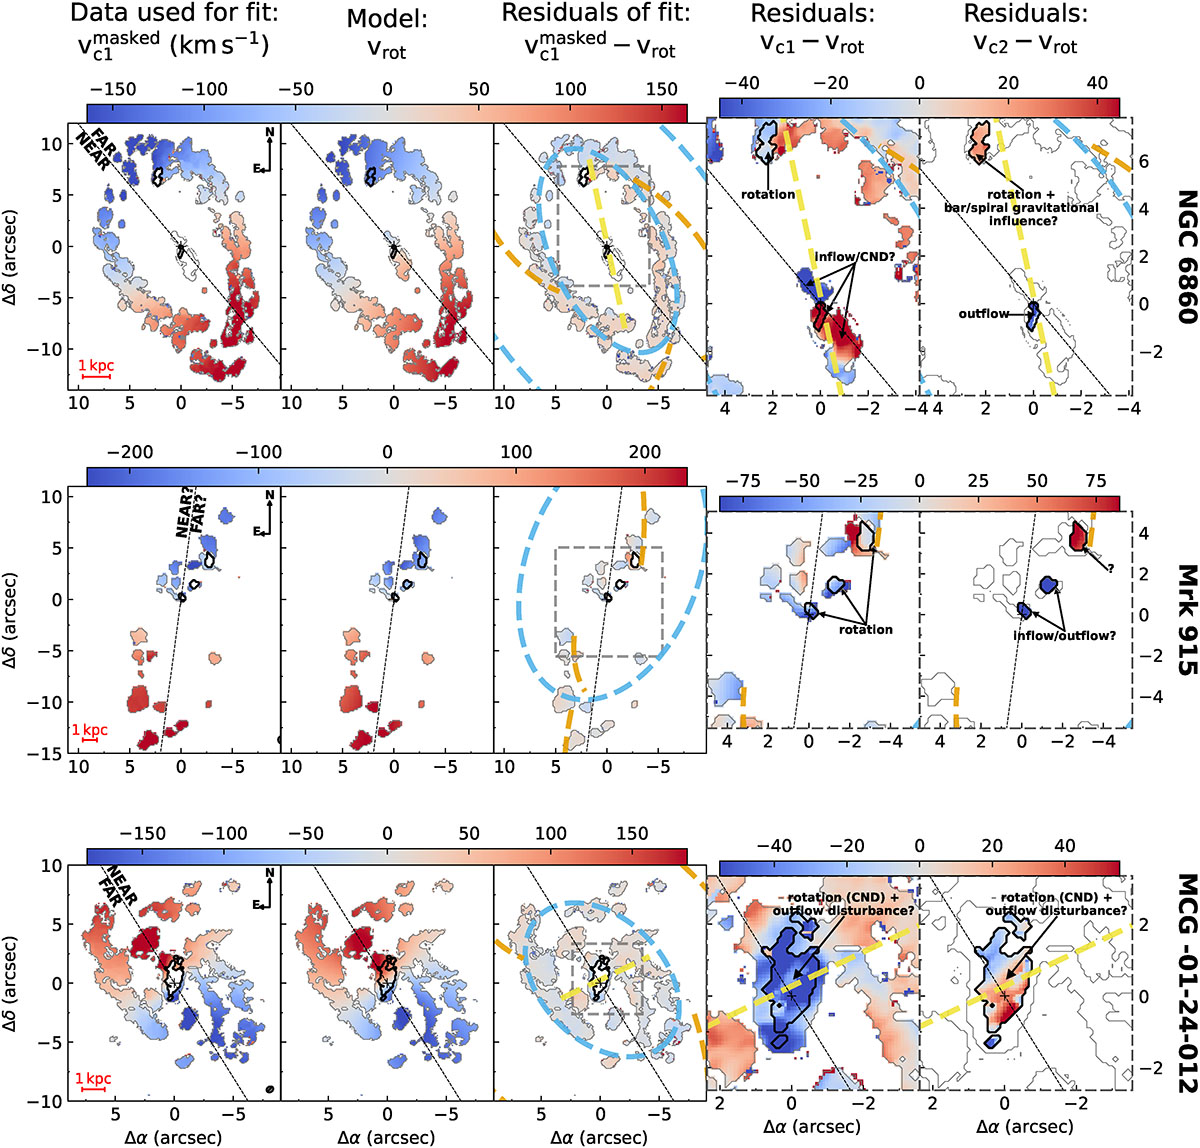
Download original image
Comparison between the CO(2-1) data obtained from the Gaussian decomposition of the profiles and the rotating 2D disk model (first three rows in Table 2). The first three columns show the distributions of the LoS velocity of the c1-component (vc1), the best-fit rotation model, and the residuals from the fit. The model was fit to the single-peak region of the vc1 data (masked regions not shown). An additional mask was used for the inner regions of NGC 6860, restricting the fit to regions dominated by rotation in the disk. The last two columns are a zoom-in showing residuals of each component (c1 and c2), with the models extended to the double-peak region. The black contours encircle the masked regions with double-peak CO profiles, while the gray contours show the full data extent. The dashed lines identify stellar structures: bars (yellow), spirals (orange), and rings (sky-blue).
Current usage metrics show cumulative count of Article Views (full-text article views including HTML views, PDF and ePub downloads, according to the available data) and Abstracts Views on Vision4Press platform.
Data correspond to usage on the plateform after 2015. The current usage metrics is available 48-96 hours after online publication and is updated daily on week days.
Initial download of the metrics may take a while.