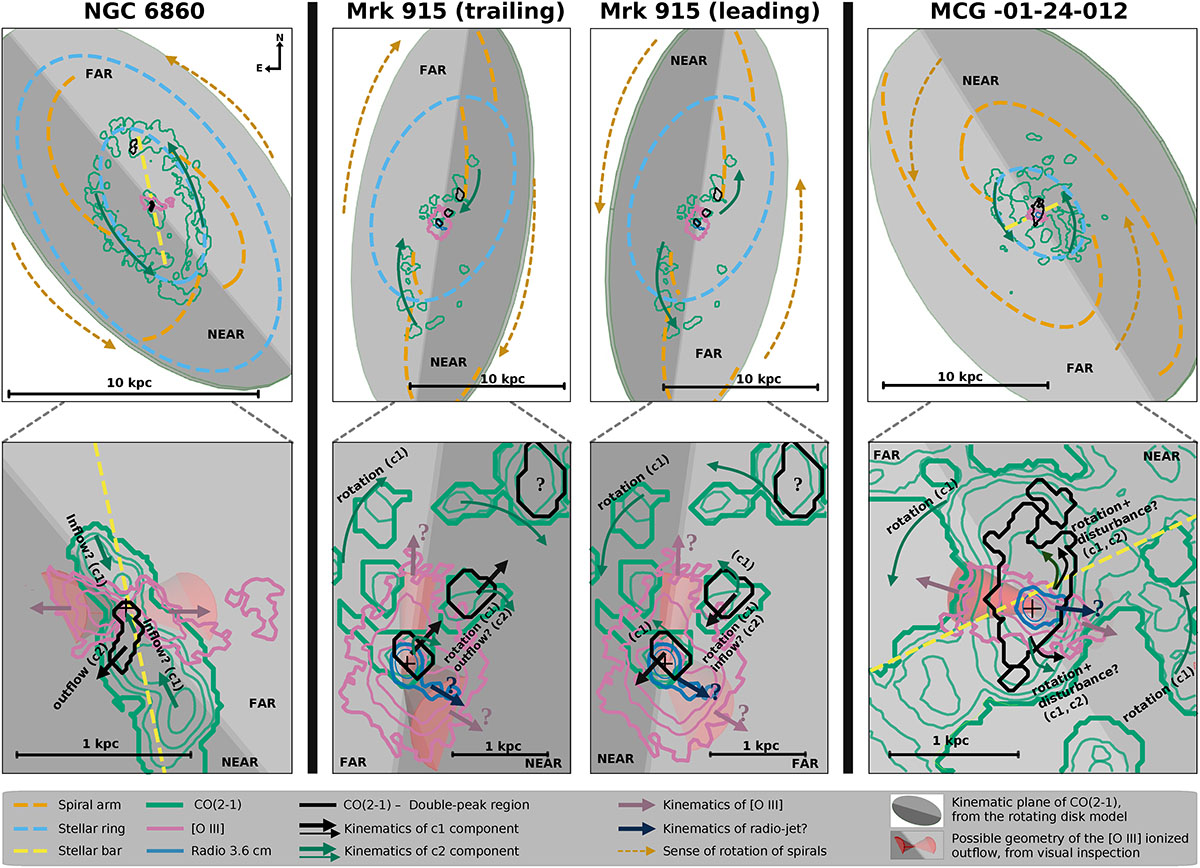
Fig. 8.
Download original image
Schematic models for our proposed scenarios of NGC 6860, Mrk 915, and MCG -01-24-012. The second row corresponds to a zoom-in in the central regions. Due to the ambiguous orientation of the Mrk 915 disk (see Appendix C), we added both scenarios of spiral arms motion: trailing and leading. The contours represent the flux distribution of: cold molecular gas from CO(2-1) M0 (bluish-green), ionized gas from HST [O III] (reddish-purple), VLA 3.6 cm radio (blue), and the CO double-peak region (black). For a better view, we plotted only a few contour levels and manually cleaned isolated ones. Stellar structures are drawn in dashed lines: spiral arms (in orange), stellar rings (sky-blue), and bars (yellow). The gray “3D” planes correspond to the plane of the global rotating disk model. We also added “3D” bipolar ionized cones to represent possible orientations of these structures. The senses of rotation of the spirals are shown in orange dashed arrows, assuming that they “follow” rotation of the CO. The solid arrows represent the direction of motion of: components c1 (blueish-green) and c2 (black) of the CO(2-1), ionized gas (reddish-purple) and radio-jets (blue), with curved lines representing rotation. We added question marks to represent that we can only confirm the kinematics of the [O III] using resolved integral-field observations, and the same for the possible radio jets that need deeper and higher spatial resolution observations. In the double-peak regions, we added one arrow for each component. In particular, for MCG -01-24-012, we tried to represent that both components are dominated by rotation, with each one having an extra positive/negative radial velocity “kick” due to the CO being disturbed equatorially by the ionized outflow.
Current usage metrics show cumulative count of Article Views (full-text article views including HTML views, PDF and ePub downloads, according to the available data) and Abstracts Views on Vision4Press platform.
Data correspond to usage on the plateform after 2015. The current usage metrics is available 48-96 hours after online publication and is updated daily on week days.
Initial download of the metrics may take a while.