Fig. 1
Download original image
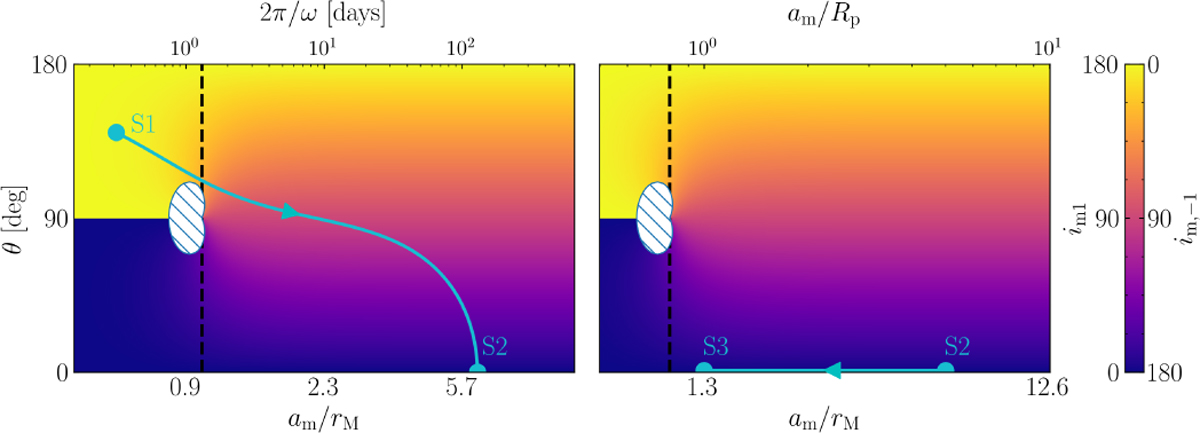
Orbital inclinations of Laplace state P1 and its twin P−1 (colorbar, given by Eqs. (18), (20)) as functions of am/rM and the planet’s obliquity θ. In both panels, the location of am = rM is denoted with a vertical black dashed line, and the E1 region (where P1 and P−1 are unstable) is shown by a white hatched zone. Across the two panels, a representative evolutionary history is shown via the three cyan points and arrows (S1, S2, S3). While the inclinations of P1 and P−1 only depend on θ and am/rM, we also illustrate the evolution using the following concrete parameters for interpretability: ap = 0.4 au, ep = 0, Rp = 2 R⊕, and mp = 10 M⊕. We then denote the corresponding values of the planet’s spin rate along the top-left axis (relevant to planetary tidal evolution) and the lunar semi-major axis along the top-right axis (relevant to lunar migration). In the left panel, the planet is initially rapidly rotating with a period of 7.5 hours, and the moon is located at am = 5Rp (S1). Then, as the planet despins and the obliquity damps, rM decreases while the moon is still located at am = 5Rp, and the system reaches S2 (we have neglected lunar tidal migration for illustrative purposes). Going from S1 to S2, the inclination of the lunar orbit smoothly flips from prograde to retrograde (assuming that the moon occupies P−1). In the right panel, as the moon inspirals, starting from S2, am decreases until the moon is disrupted by the planet when am ≃ Rp ≳ rM (S3).
Current usage metrics show cumulative count of Article Views (full-text article views including HTML views, PDF and ePub downloads, according to the available data) and Abstracts Views on Vision4Press platform.
Data correspond to usage on the plateform after 2015. The current usage metrics is available 48-96 hours after online publication and is updated daily on week days.
Initial download of the metrics may take a while.