Fig. 2
Download original image
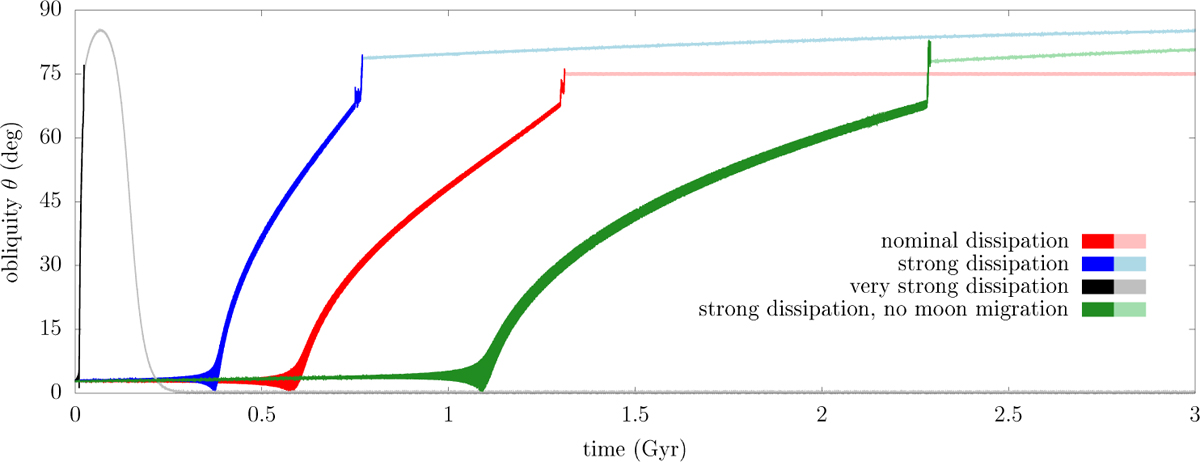
Example of obliquity evolution of the planet HIP 41378 f and a hypothetical moon. The mass of the moon is m/M = 7 × 10⁻⁴, and it is initialized at a distance am = 5 Rp. For the red, blue, and black curves, the lunar migration rate is analogous to that measured for Io and Jupiter (Lainey et al. 2009). Dark colors show the trajectory when the moon is still present; light colors show the trajectory after the loss of the moon, assumed to be instantly disrupted once its pericenter goes below the Roche limit. For the red curve, the star–planet tidal dissipation is taken into account with tidal time-lag ∆t = 3×10⁻⁹ years. For the blue curve, the star–planet tidal dissipation is artificially increased using ∆t = 2×10⁻⁴ years. For the black curve, the star–planet tidal dissipation is artificially increased using ∆t = 2 × 10⁻² years. For the green curve, the moon’s migration is turned off, and the star–planet tidal dissipation is taken into account using ∆t = 2 × 10⁻⁴ years.
Current usage metrics show cumulative count of Article Views (full-text article views including HTML views, PDF and ePub downloads, according to the available data) and Abstracts Views on Vision4Press platform.
Data correspond to usage on the plateform after 2015. The current usage metrics is available 48-96 hours after online publication and is updated daily on week days.
Initial download of the metrics may take a while.