Fig. 7
Download original image
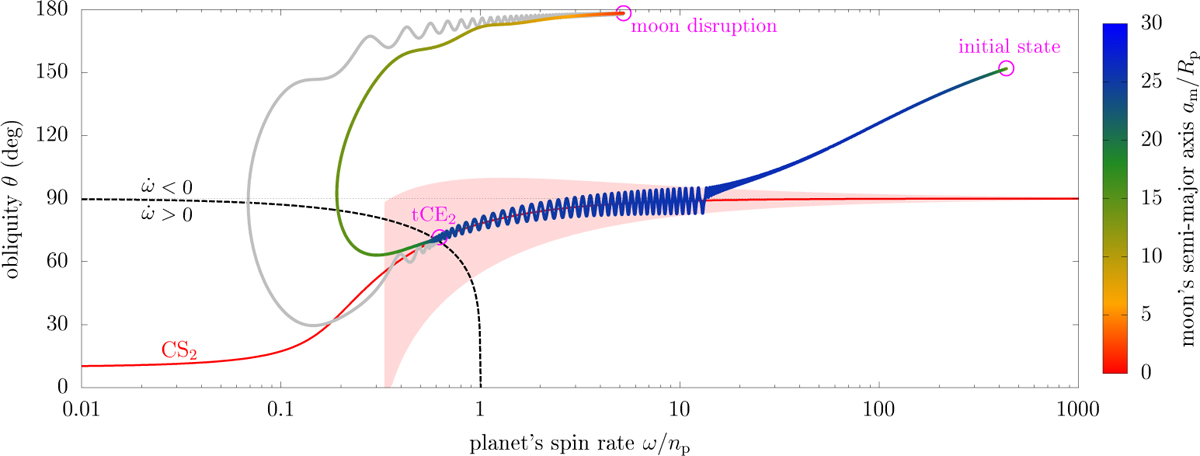
Example of ejection from a tidal Cassini Equilibrium due to moon inspiral. The color of the curve shows the moon’s distance to the planet; the gray curve shows the evolution after the moon has been lost. The center of the resonance (Cassini state 2; red curve) and its width (pink region) are shown at capture time, when the moon’s semi-major axis is am ≈ 25 Rp. Along the dashed black curve, the star-driven tidal dissipation results in ![]() (see Eq. (8)).
(see Eq. (8)).
Current usage metrics show cumulative count of Article Views (full-text article views including HTML views, PDF and ePub downloads, according to the available data) and Abstracts Views on Vision4Press platform.
Data correspond to usage on the plateform after 2015. The current usage metrics is available 48-96 hours after online publication and is updated daily on week days.
Initial download of the metrics may take a while.