Open Access
Fig. 11
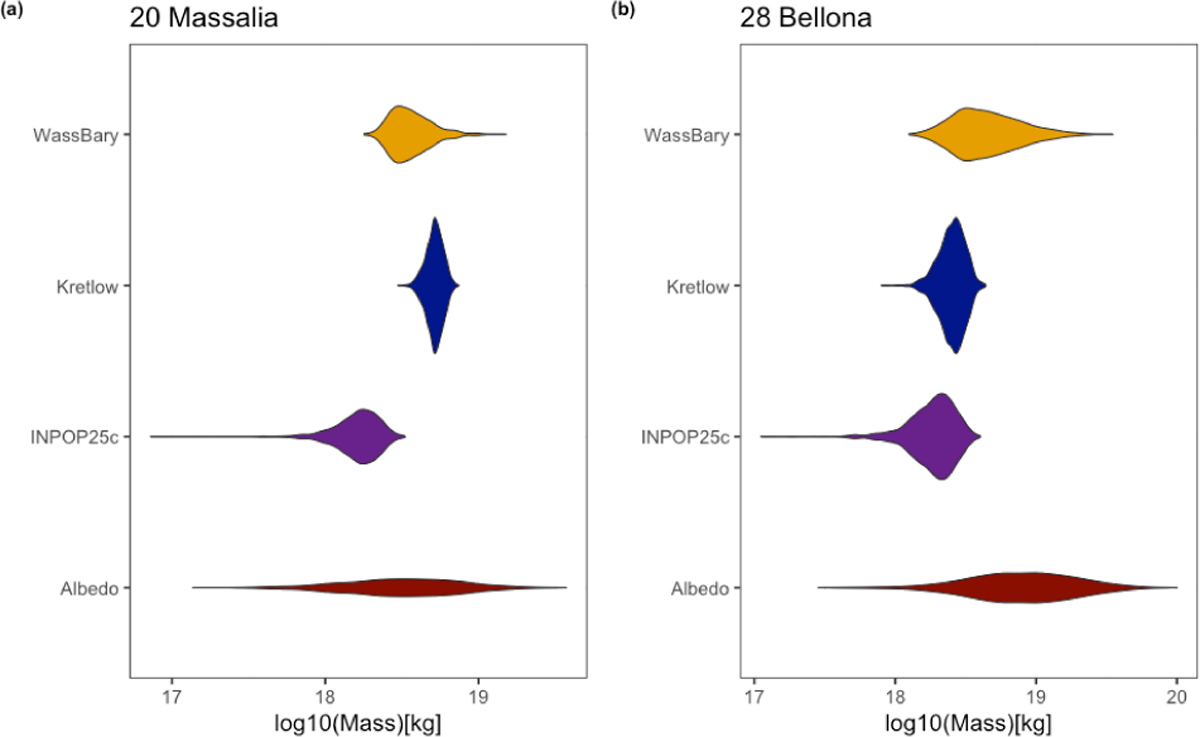
Download original image
Histograms of the mass distributions for (28) Bellona estimated from INPOP25c, neural networks and albedo (Sect. 3.2.1 and Murray 2023 and Kretlow 2020). The Wasserstein barycenter resulting from the three posteriors cited is shown in yellow.
Current usage metrics show cumulative count of Article Views (full-text article views including HTML views, PDF and ePub downloads, according to the available data) and Abstracts Views on Vision4Press platform.
Data correspond to usage on the plateform after 2015. The current usage metrics is available 48-96 hours after online publication and is updated daily on week days.
Initial download of the metrics may take a while.