Fig. 8
Download original image
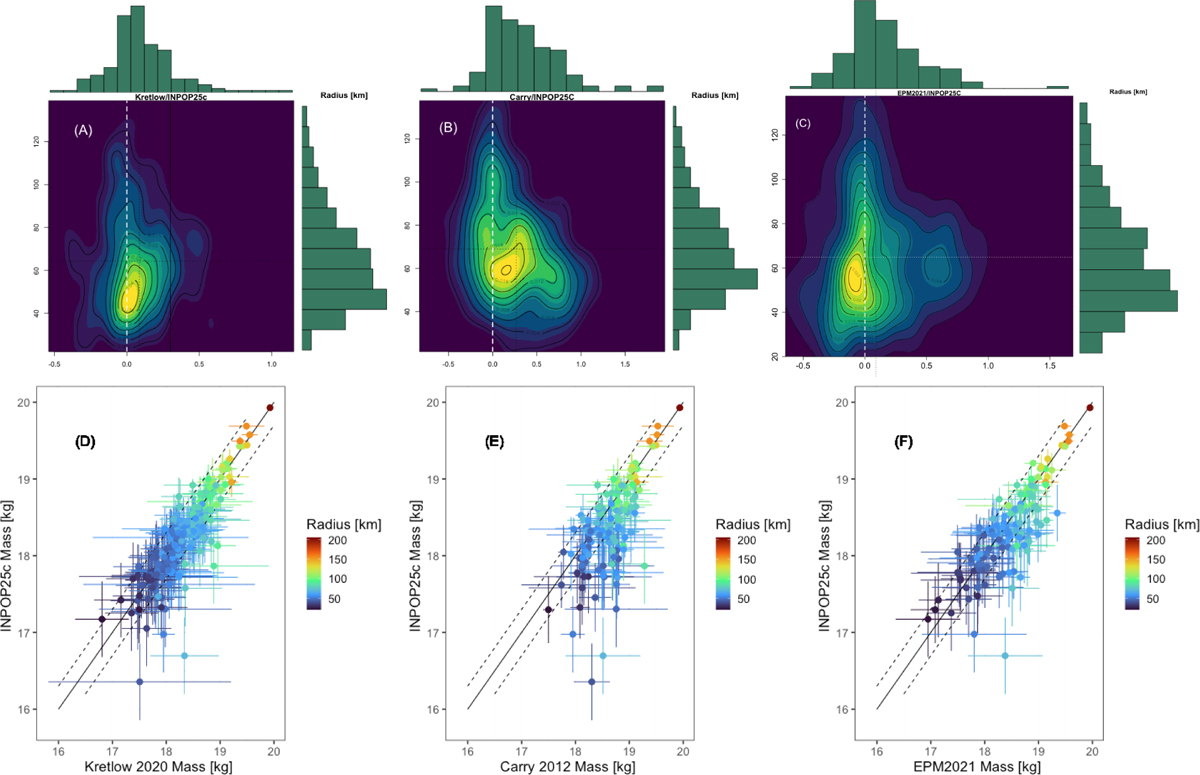
Comparisons between INPOP25c, Carry (2012), Kretlow (2020), and Pitjeva et al. (2019). Panels A–C show the 2D histograms of the radii in kilometers and ratio Kretlow (2020)/INPOP25c (A), the ratio Carry (2012)/INPOP25c (B), and the ratio Pitjeva et al. (2019)/INPOP25c (C). Panels D, E, and F show the masses of INPOP25c vs. the Kretlow (2020) masses (C), masses of INPOP25c vs. Carry (2012) (D), and vs. Pitjeva et al. (2019) masses in panel (F). The color indicates the radii in kilometers.
Current usage metrics show cumulative count of Article Views (full-text article views including HTML views, PDF and ePub downloads, according to the available data) and Abstracts Views on Vision4Press platform.
Data correspond to usage on the plateform after 2015. The current usage metrics is available 48-96 hours after online publication and is updated daily on week days.
Initial download of the metrics may take a while.