Fig. A.1.
Download original image
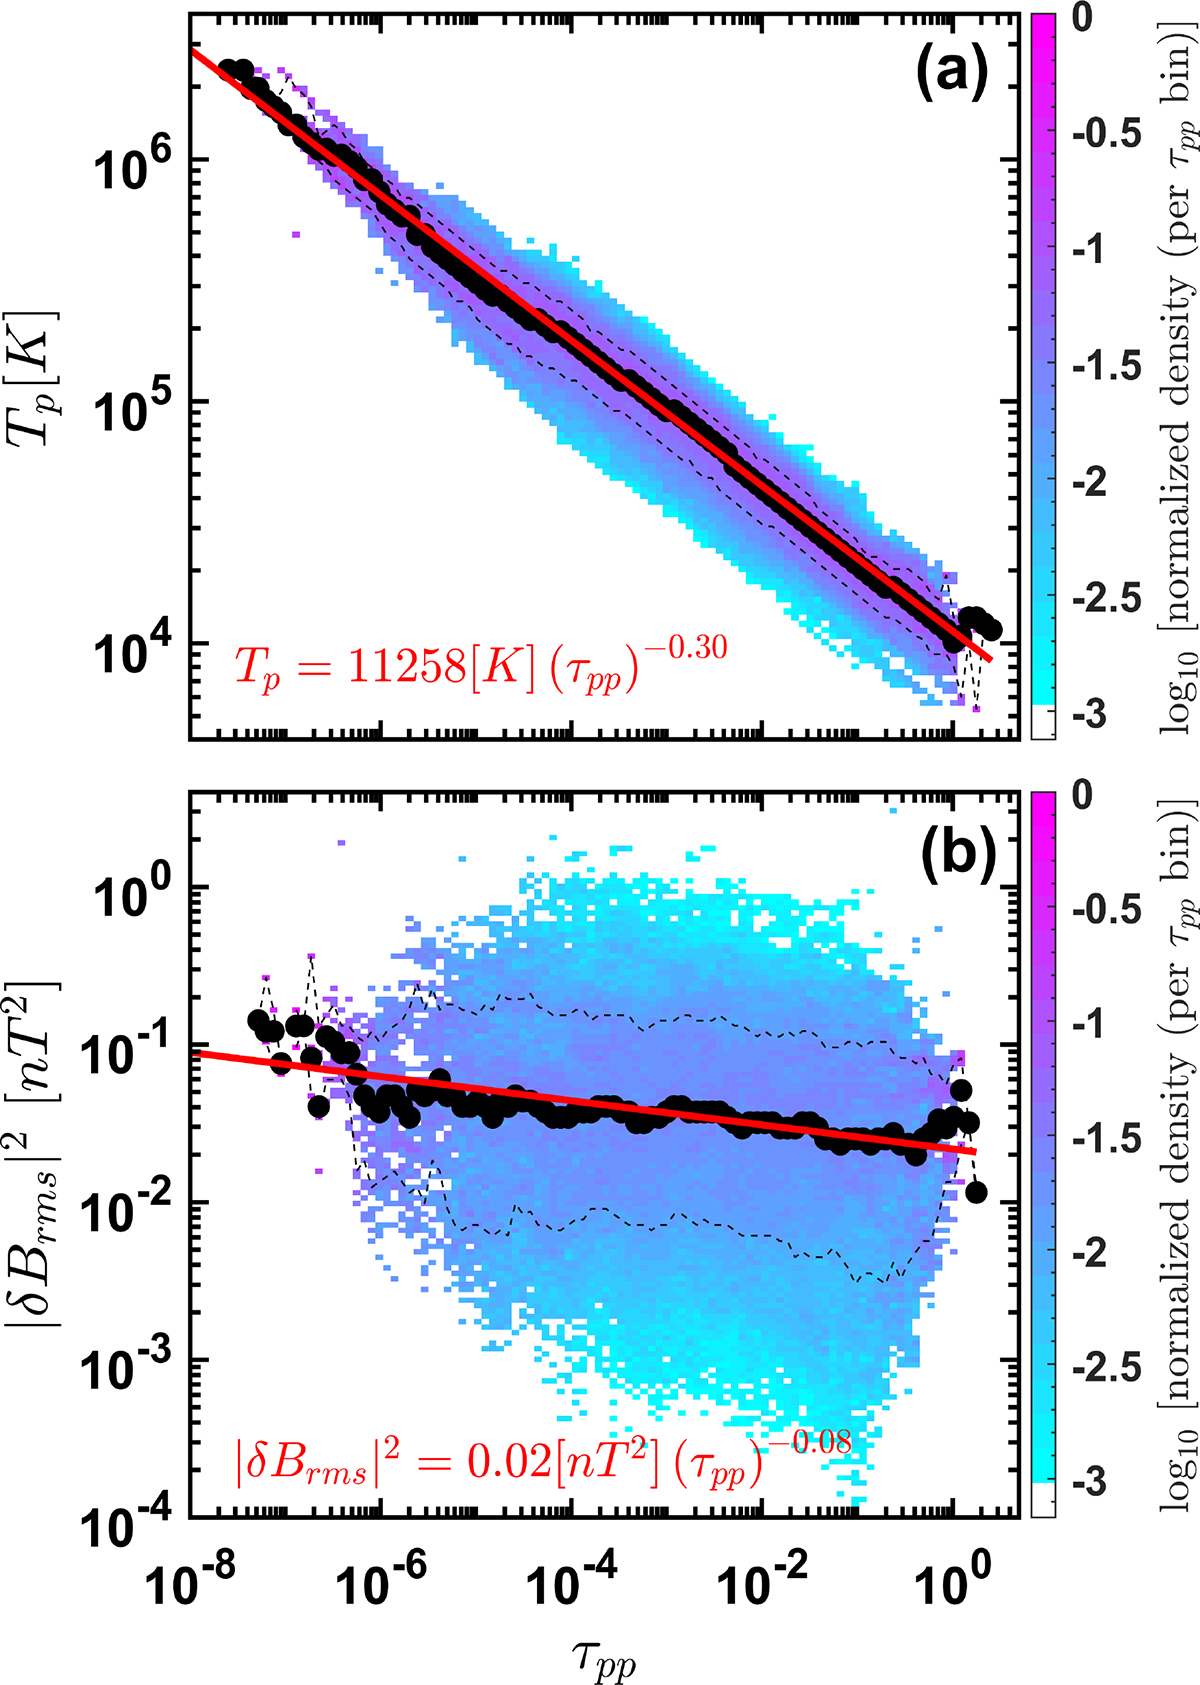
(a) 2D histogram showing the bin-wise normalised probability density of proton temperature Tp vs collisional age, τpp. The black-filled circles indicate the median Tp values in each τpp bin, while the dashed lines represent the 15th and 85th percentiles. The red line shows a power-law fit to the median trend, with the fitted scaling exponent indicated. (b) Similar 2D histogram of the magnetic fluctuation power |δBrms|2 vs τpp. The median and percentile statistics as well as the power-law fit are shown.
Current usage metrics show cumulative count of Article Views (full-text article views including HTML views, PDF and ePub downloads, according to the available data) and Abstracts Views on Vision4Press platform.
Data correspond to usage on the plateform after 2015. The current usage metrics is available 48-96 hours after online publication and is updated daily on week days.
Initial download of the metrics may take a while.