| Issue |
A&A
Volume 705, January 2026
|
|
|---|---|---|
| Article Number | A91 | |
| Number of page(s) | 7 | |
| Section | The Sun and the Heliosphere | |
| DOI | https://doi.org/10.1051/0004-6361/202555506 | |
| Published online | 09 January 2026 | |
Temperature anisotropy, instabilities, and thermal processes in low-β plasma
1
William B. Hanson Center for Space Sciences, University of Texas at Dallas, Richardson, TX, USA
2
Mullard Space Science Laboratory, University College London, Holmbury St. Mary, Dorking, UK
3
Department of Physics & Astronomy and Bartol Research Institute, University of Delaware, 104 The Green, Newark, DE 19716, USA
★ Corresponding author: This email address is being protected from spambots. You need JavaScript enabled to view it.
, This email address is being protected from spambots. You need JavaScript enabled to view it.
Received:
13
May
2025
Accepted:
3
November
2025
Abstract
Interplanetary coronal mass ejections (ICMEs) are large-scale magnetic structures that influence heliospheric dynamics and space weather. While wave activity has been observed within their low-β (≪1) magnetic obstacles, the role of temperature anisotropy and instability remains underexplored. This study examines proton temperature anisotropies, heating, cooling, turbulence, and collisional effects within ICME magnetic obstacles, which are low-β plasmas. Using Wind spacecraft data from 382 ICME magnetic obstacles at 1 au (spanning 1995–2021), we observe that proton temperature and proton βp follow log-normal distributions. The anisotropy within these regions is primarily constrained to the stable parameter regime below the thresholds for the mirror-mode and oblique firehose instabilities. Additionally, plasmas unstable to proton cyclotron and firehose instabilities exhibit temperatures that are significantly higher – 50 to 100 times higher than those of stable plasma. Notably, enhanced magnetic fluctuations and low collisional age are observed near instability thresholds, regardless of beta. Although a clear relationship exists between temperature and collisional age, the correlation between turbulent amplitude and collisional age is weak, differing from trends observed in the solar wind. Our results suggest a causal chain whereby high turbulence amplitudes are associated with enhanced heating, linked to reduced collisions, causing increased temperature anisotropy, and ultimately favouring the development of instabilities within ICME magnetic obstacles.
Key words: plasmas / turbulence / Sun: coronal mass ejections (CMEs) / Sun: magnetic fields / solar wind
© The Authors 2026
 Open Access article, published by EDP Sciences, under the terms of the Creative Commons Attribution License (https://creativecommons.org/licenses/by/4.0), which permits unrestricted use, distribution, and reproduction in any medium, provided the original work is properly cited.
This article is published in open access under the Subscribe to Open model. This email address is being protected from spambots. You need JavaScript enabled to view it. to support open access publication.
1. Introduction
The solar wind typically exhibits proton beta values in the range 0.1 ≲ βp ≲ 10, providing an ideal environment in which to study key plasma processes, including anisotropy, turbulence, and instabilities (Bruno & Carbone 2013; Hellinger et al. 2006; Yoon 2017). The sources and processes that regulate temperature anisotropy, defined as Rp ≡ Tp⊥/Tp∥ ≠ 1, where Tp∥ (Tp⊥) represents the proton temperature parallel (perpendicular) to the magnetic field, are key unresolved issues (Marsch et al. 1982; Verscharen et al. 2017; Yoon 2017). When anisotropy exceeds a certain threshold, plasma instabilities, such as mirror mode (MM), ion (proton) cyclotron (PC), parallel fire hose (PF), and oblique fire hose (OF), may arise (Gary 1993; Yoon 2017). These instabilities, which generate electromagnetic fluctuations, regulate anisotropy, returning the plasma towards a state of marginal stability (Gary 1993; Hellinger et al. 2006; Kasper et al. 2008; Yoon 2017). The parametric representation of the instability thresholds Rp and parallel proton β, βp∥ = NpkBTp∥/B2/2μ0, is often expressed empirically as Rp = 1 + a/(βp∥ − β0)b, where a, b, and β0 are parameters corresponding to different instabilities and different growth rates (Hellinger et al. 2006; Maruca et al. 2012; Verscharen et al. 2019; Huang et al. 2020). Instabilities are characterised by the growth rate γ ≥ 0. The contours of γ = 0 divide the (βp∥, Rp) plane into stable and unstable regions. In this study, we use the γ ∼ 10−3Ωp value; plasma is considered unstable if it exceeds the threshold for a given instability (Gary 1993; Verscharen et al. 2019).
In the solar wind, proton anisotropy is regulated by MM and firehose instabilities (Kasper et al. 2002; Hellinger et al. 2006; Matteini et al. 2007; Bale et al. 2009; Maruca et al. 2011; Shaaban et al. 2017; Huang et al. 2020), where the plasma unstable to these instabilities is three to four times hotter than the stable plasma (Maruca et al. 2011). In Earth’s high-beta magnetosheath, all four major instabilities (PC and MM; PF and OF) constrain anisotropy (Maruca et al. 2018). The Chew–Goldberger–Low (CGL) double-adiabatic expansion leads to faster cooling of Tp⊥ than Tp‖ in the inner heliosphere (Chew et al. 1956). Perpendicular heating arises from resonant damping of Alfvén ion-cyclotron waves (e.g. Cranmer et al. 1999; Isenberg 2001), while kinetic Alfvén wave damping contributes to both parallel and perpendicular heating (Sahraoui et al. 2009; Chandran et al. 2010). The solar wind instabilities are associated with magnetic field fluctuations, proton temperature, and collisional age, particularly near instability thresholds (Bale et al. 2009; Yoon 2016). Collisional processes reduce anisotropies, suppress fluctuations, and promote isotropisation (Vafin et al. 2019; Yoon et al. 2024).
Interplanetary coronal mass ejections (ICMEs) are large-scale solar eruptions that comprise a shock front, a high-beta sheath region (βp ≥ 1), and a low-beta magnetic obstacle (MO; βp ≪ 1), often containing magnetic flux ropes (Bothmer & Daglis 2007; Kilpua et al. 2017; Nieves-Chinchilla et al. 2019). A recent study by Shaikh et al. (2023) shows that MM and firehose instabilities constrain proton anisotropy within the ICME sheath, which is a high β plasma (βp ≳ 1). Plasma that is unstable to PC or firehose instabilities is five to ten times hotter than stable plasma (Shaikh et al. 2024), where collisions and magnetic fluctuations contribute to regulating anisotropy. Various wave activities, including Alfvén ion cyclotron (Dhamane et al. 2023), torsional (Raghav et al. 2018), surface (Raghav et al. 2023), and kinetic Alfvén waves (Kumbhar et al. 2024), as well as low-frequency waves (Siu-Tapia et al. 2015), have been observed within MOs (Zhao et al. 2021; Shaikh 2024). However, the nature of temperature anisotropies and kinetic instabilities in low-βp MOs remains largely unexplored. This article aims to address this gap by examining the interplay of temperature anisotropy-driven instabilities, heating and cooling processes, collisional age, and turbulence within the ICME MOs.
2. Analysis and results
We analysed 382 ICME MOs from 1995 to 2021, spanning solar cycles 23–24, and part of solar cycle 251. We used magnetic field data obtained from the Magnetic Field Investigation (MFI) (Lepping et al. 1995) and plasma data from the Solar Wind Experiment (SWE) instruments (Ogilvie et al. 1995) on board the Wind spacecraft2. The proton density (Np) and proton temperature (Tp), both parallel (Tp∥) and perpendicular (Tp⊥) to the magnetic field, were derived from a bi-Maxwellian non-linear least-squares fit, resolving parallel and perpendicular components at a 92 second resolution. The instrument’s angular and energy resolution may lead to minor biases in the derived temperature anisotropy (Appendix C). To avoid contamination from adjacent high-temperature plasma, we trimmed 1 hour from both edges of the nominal MO boundaries, ensuring that the MO intervals excluded the sheath region and solar wind plasma. Figure 1a shows the probability distributions of the components Tp, Tp∥, and Tp⊥ of all the ICME MOs analysed, following a log-normal trend skewed to the right. The mean ( ) values of Tp ∼ 104.79 K, Tp∥ ∼ 104.82 K, and Tp⊥ ∼ 104.76 K, and respective median (
 ) values are 104.77 K, 104.78 K, and 104.73 K, respectively. We observed that Tp∥ is statistically higher than Tp⊥. Similarly, panel (b) presents the distributions of proton beta (βp, including βp∥ and βp⊥, which exhibit a left-skewed log-normal trend, with βp∥ typically greater than βp⊥.
Figure 1c presents the probability density distribution of the data in the (βp∥, Rp = Tp⊥/Tp∥) parameter space, binned on a 200 × 200 logarithmic grid, with logarithmically spaced bin sizes of 0.034 (βp∥) and 0.026 (Rp). Moreover, bins containing fifteen or fewer data points are shaded in light grey to indicate regions with insufficient statistics, ensuring that the plotted medians reflect only well-populated bins. The colour bar presents the probability density p(βp∥, Rp) = n/(NΔβp∥ΔRp), where n is the number of data points per bin, N is the total number of data bins, and Δβp∥ and ΔRp are the widths of the bins in both dimensions of this parameter space. The overlay instability threshold for PC, MM, PF, and OF is based on the linear Vlasov-Maxwell theory (Hellinger et al. 2006) for γ = 10−3Ωp. Thus, the data distribution is limited to the stable parameter space by the threshold curves. For Rp > 1, the MM instability mainly constrains the distribution, while for Rp < 1 the OF instability provides a tighter bound. In particular, the PC threshold does not strictly limit the distribution, even at βp∥ ≤ 1.
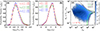 |
Fig. 1. Probability density distribution of (a) proton temperature (Tp) and its components (Tp∥ and Tp⊥); and (b) proton beta (βp) with its parallel (βp∥) and perpendicular (βp⊥) components, observed during all 382 ICME MOs. The mean ( |


Figure 2 shows the median values of Tp, Tp∥, and Tp⊥ in each bin across the (βp∥, Rp) plane. Panel (a) shows regions with high Tp near and above the thresholds, especially in plasma that is unstable to PC, near the MM threshold, and around the PF and OF instability. Even at βp∥ > 1, Tp remains high near Rp = 1, differing from the solar wind (Maruca et al. 2011), but consistent with the ICME sheath (Shaikh et al. 2024). Panels (b) and (c) show the median Tp⊥ and Tp∥ distributions; they illustrate that the increase in Tp near the PF and OF thresholds is primarily driven by an increase in the Tp∥, while a higher Tp in the PC-unstable region is dominated by an elevated Tp⊥. Since both βp and Rp depend on temperature, some trends naturally reflect their inter-dependent definitions. For βp∥ < 1, high Tp and Tp⊥ are predominantly observed for Rp > 1, whereas the median temperature reaches a minimum value near Rp ∼ 1 in the (Rp, βp∥) plane. Conversely, for βp∥ ≥ 1, the Rp dependence of Tp becomes less pronounced. Plasma near or above the instability thresholds tends to be 50 to 100 times hotter than that in more stable regions. For βp∥ > 1, Tp⊥ increases near the OF threshold and around Rp = 1, though some variations may be influenced by binning artefacts. Figure 3a shows the median collisional age, τpp = νppL/Vsw, across the (βp∥, Rp) plane, where νpp is the frequency of proton-proton anisotropy-relaxation collisions; L = 1 au; Vsw denotes the speed of the solar wind (Bale et al. 2009; Hellinger & Trávníček 2014; Shaikh et al. 2024); and τpp estimates the number of Coulomb collisions experienced by a proton as it propagates from the Sun to 1 au, under the assumption of constant plasma properties (see details in Appendix B). For βp∥ < 1, τpp peaks near Rp ∼ 1, indicating stronger collisional isotropisation, consistent with the solar wind and the ICME sheath trends (Bale et al. 2009; Hellinger & Trávníček 2014; Vafin et al. 2019; Shaikh et al. 2024). At high Rp > 1, τpp is lower, mainly in regions near or above the instability threshold. For βp∥ > 1, the lowest value of τpp is found near the OF instability threshold, rather than the MM and PC thresholds. We observe low τpp, over a wide range of beta, 0.1 < βp∥ < 10. It is not clear what causes low average τpp when 0.1 < βp∥ < 1 for Rp < 1. Figure A.1a shows the anti-correlation between Tp and τpp, which follows  . Figure 3b shows the median δBrms/B0 (see Appendix A) across the
  plane. We find lower magnetic fluctuations in regions with βp‖ < 2 and Tp⊥ < Tp‖, while they increase when Tp⊥ > Tp‖, particularly for βp‖ > 2. Fluctuations are strongest near instability thresholds, including PC (Rp ≳ 1), PF/OF (Rp ≲ 1), and MM. Moreover, Figure A.1b shows the dependence of the magnetic fluctuation amplitude |δBrms|2 on τpp following the relation,
  , which is very weak compared to the solar wind (Bale et al. 2009).
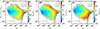 |
Fig. 2. Plots of bin-median (a) Tp, (b) Tp⊥, and (c) Tp∥ in the (βp∥, Rp) plane. The over-plotted curves represent instability thresholds, as seen in Figure 1c. The increase in Tp occurs near or beyond the PC and OF instability thresholds, with Tp⊥ enhanced beyond the OF threshold and Tp∥ beyond the PC threshold for βp∥ > 1. Bins with less than 15 data points are shown in grey, denoting regions of low statistical significance. |
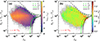 |
Fig. 3. Plot of bin-median (a) collisional age (τpp) and (b) magnetic fluctuation amplitude (δBrms/Bo) in the (βp∥, Rp) plane. The τpp is highest around Rp ∼ 1, suggesting that the plasma is largely isotropised by Coulomb collisions, and that anisotropic plasma is mostly collisionless. The δBrms/Bo shows enhancement in the vicinity of the instability thresholds and at the high βp∥ > 1. |
3. Discussion
For the first time, using the Wind spacecraft, we investigate the proton temperature anisotropy within 382 ICME MOs. In the (Rp,βp‖) plane, irrespective of βp‖, MM and OF instabilities primarily limit the anisotropy. This contrasts with linear theory, which predicts PC dominance at low βp‖ ≪ 1 (Gary 1993; Hellinger et al. 2006). The exact cause of this discrepancy remains largely unknown, but our observations align with findings in ICME sheath plasma (Shaikh et al. 2023, 2024) and the solar wind (Hellinger et al. 2006; Bale et al. 2009; Maruca et al. 2011). Recently, Walters et al. (2023) demonstrated that non-equilibrium velocity distributions shift the Alfvén ion-cyclotron instability thresholds away from those predicted by bi-Maxwellian models, offering a possible explanation for the discrepancies between theoretical predictions and observations.
Plasma near or above the cyclotron and firehose instability thresholds within ICME MOs is 50–100 times hotter than stable plasma, with Tp predominantly enhanced mainly by elevated Tp⊥ when Rp > 1. Conversely, when Rp < 1, the parallel temperature dominates, and the increase in Tp is mainly driven by an increase in Tp‖, which may arise from parallel heating mechanisms such as Landau damping. In this high-βp regime, i.e. βp‖ ≥ 1, the proton temperature remains elevated, but the anisotropy is weak, implying Tp⊥ ∼ Tp‖. The observed trend indicates that while temperature anisotropies can persist in low-βp conditions due to selective heating mechanisms, high-βp plasmas (βp‖ ≥ 1) are more likely to undergo isotropisation, possibly driven by instabilities which have lower thresholds at larger βp∥. Plasma that is unstable to these instabilities is, on average, three to four times hotter in the solar wind (Maruca et al. 2011) and five to ten times hotter in the ICME sheaths (Shaikh et al. 2024). Anisotropic cooling from CGL expansion (Chew et al. 1956) and wave activity may explain the observed heating (Chew et al. 1956; Dhamane et al. 2023; Raghav et al. 2018, 2023; Kumbhar et al. 2024; Dasso et al. 2003). Moreover, the compression of MO plasma due to interactions with solar wind structures or other ICMEs enhances magnetic fluctuations, which likely occur on a shorter timescale than adiabatic expansion, leading to dominant heating and a greater temperature increase in ICME MOs compared to the solar wind. Our observations are qualitatively consistent with the ICME sheath Shaikh et al. (2024) and distinct from the solar wind (Maruca et al. 2011).
We observe that collisions tend to maintain near-isotropic conditions; however, as the plasma temperature increases and the collision rate decreases, temperature anisotropy can develop, leading to enhanced kinetic instabilities. While theory predicts Tp, our weaker observed dependence suggests complex interdependencies between physical parameters. Large-scale magnetic fluctuations cascade to smaller scales, thereby heating the plasma and reducing collisionality, which in turn facilitates anisotropy growth. These fluctuations are therefore closely linked to proton temperature anisotropy, Rp, through a chain of processes involving turbulence and wave–particle interactions in space plasmas. When δBrms/B0 > 1, the field becomes highly disordered, typical of turbulent or shock-dominated regions. Although MMs are compressive, their contribution is likely minor at these scales (Ala-Lahti et al. 2018). Since δBrms/B0 includes both compressive and transverse fluctuations, it provides favourable conditions for the growth of instabilities. The damping of the cascaded fluctuations heats the plasma, making it less collisional, allowing temperature anisotropies to form and reach the thresholds (Bale et al. 2009; Southwood & Kivelson 1993; Verscharen et al. 2013). We observe strong magnetic fluctuations near and above the PC and firehose instability thresholds, suggesting that turbulence plays a crucial role in sustaining anisotropy and influencing plasma collisionality within ICME MOs (Opie et al. 2024). Turbulence drives local anisotropic heating, which eventually pushes the plasma beyond the instability thresholds (Qudsi et al. 2020). Previous studies indicate that the scattering rate follows  , with L = 1 au (Bale et al. 2009; Shaikh et al. 2024). Applying this to ICME MOs, instability requires
  , implying that the pitch-angle scattering rate (ν) must be greater than the rate of magnetic field variations in order to effectively constrain the anisotropy. Observations reveal ⟨δBrms/B0⟩≥10−1 near instability thresholds and in high βp regions, consistent with ICME sheath (Shaikh et al. 2024) and solar wind findings (at a shorter scale) (Bale et al. 2009). In addition, we observe that collisions play a crucial role in maintaining isotropic plasma conditions within ICME MOs. This is consistent with observations in the ICME sheath (Shaikh et al. 2024), but significantly weaker compared to the solar wind (Hellinger & Trávníček 2014).
4. Conclusions
Our study highlights the critical role of MM and OF instabilities in regulating proton temperature anisotropy within ICME MOs. The MM threshold tightly constrains the upper edge of the distribution more than the OF threshold, which is also observed in solar wind studies (Hellinger et al. 2006; Bale et al. 2009), but why this is the case is an open question. This can be attributed to differences in the growth rates and saturation mechanisms of these instabilities. This could be due to the fact that the MM instability has relatively high growth and can quickly scatter particles to reduce anisotropy. In contrast, the OF instability grows more slowly or saturates at lower amplitudes; therefore, it might not regulate the plasma as effectively, and the plasma can transiently remain beyond the OF threshold. Furthermore, the ICME plasma may experience transient anisotropies due to expansion, waves, transient processes or flow shears, which may keep the plasma temporarily unstable. Moreover, the linear thresholds used here do not fully capture non-linear or kinetic effects. We observe a fifty- to hundred-times increase in proton temperature where the plasma is unstable to PC or near the MM and OF thresholds. These instabilities arise from anisotropy and, through scattering and energy redistribution, regulate further anisotropy growth. This feedback mechanism maintains the plasma in a state close to marginal stability, thereby tightly constraining temperature anisotropies. This finding is significant because it suggests that these instabilities act as natural constraints on temperature anisotropies in low-beta plasma within ICME MOs. While this behaviour closely resembles what has been observed in ICME sheaths (Shaikh et al. 2023, 2024), it stands in contrast to trends reported in the solar wind (Maruca et al. 2012; Bale et al. 2009), indicating that ICME structures exhibit distinct plasma regulation mechanisms. The observed temperature enhancement is likely driven by the presence of strong magnetic fluctuations, which facilitate energy redistribution, preventing rapid thermal equilibration. This points to a causal chain in which the high level of turbulence amplitudes leads to enhanced heating, reduced collisionality, increased temperature anisotropy, and the development of kinetic instabilities. This insight underscores the importance of kinetic processes in shaping plasma dynamics within a low-βp plasma and contributes to our broader understanding of energy dissipation and stability in space plasmas.
Acknowledgments
We thank the Wind spacecraft team and the SWE and MFI instrument teams for providing publicly available data (https://wind.nasa.gov/data.php). D.V. is supported by STFC Consolidated Grant ST/W001004/1. The work of Z.S. and I.V. was supported by NASA project 80NSSC22K1634. The authors thank anonymous referee for valuable comments and suggestions that improve the manuscript.
References
- Ala-Lahti, M. M., Kilpua, E. K., Dimmock, A. P., et al. 2018, Ann. Geophys., 36, 793 [CrossRef] [Google Scholar]
- Bale, S., Kasper, J., Howes, G., et al. 2009, PRL, 103, 211101 [Google Scholar]
- Bothmer, V., & Daglis, I. A. 2007, Space Weather: Physics and Effects (Springer Science& Business Media) [Google Scholar]
- Bruno, R., & Carbone, V. 2013, Liv. Rev. Sol. Phys., 10, 2 [Google Scholar]
- Chandran, B. D., Li, B., Rogers, B. N., Quataert, E., & Germaschewski, K. 2010, ApJ, 720, 503 [NASA ADS] [CrossRef] [Google Scholar]
- Chew, G., Goldberger, M., & Low, F. 1956, Proc. R. Soc. Lond. Ser. A, Math. Phys. Sci., 236, 112 [Google Scholar]
- Cranmer, S. R., Field, G. B., & Kohl, J. L. 1999, ApJ, 518, 937 [Google Scholar]
- Dasso, S., Gratton, F. T., & Farrugia, C. J. 2003, JGR, 108, 1149 [Google Scholar]
- Dhamane, O., Pawaskar, V., Raghav, A., et al. 2023, ApJ, 957, 38 [Google Scholar]
- Gary, S. P. 1993, Theory of Space Plasma Microinstabilities No. 7 (Cambridge University Press) [Google Scholar]
- Hellinger, P., & Trávníček, P. M. 2014, ApJ, 784, L15 [Google Scholar]
- Hellinger, P., Trávníček, P., Kasper, J. C., & Lazarus, A. J. 2006, GRL, 33 [Google Scholar]
- Huang, J., Kasper, J. C., Vech, D., et al. 2020, ApJS, 246, 70 [Google Scholar]
- Isenberg, P. A. 2001, JGR, 106, 29249 [Google Scholar]
- Kasper, J. C., Lazarus, A. J., & Gary, S. P. 2002, GRL, 29, 20 [Google Scholar]
- Kasper, J. C., Lazarus, A. J., Steinberg, J. T., Ogilvie, K. W., & Szabo, A. 2006, JGR, 111, A03105 [Google Scholar]
- Kasper, J., Lazarus, A., & Gary, S. 2008, PRL, 101, 261103 [Google Scholar]
- Kilpua, E., Koskinen, H. E., & Pulkkinen, T. I. 2017, Liv. Rev. Sol. Phys., 14, 5 [NASA ADS] [CrossRef] [Google Scholar]
- Kumbhar, K., Raghav, A., Dhamane, O., et al. 2024, ApJ, 965, 139 [Google Scholar]
- Lepping, R., Acũna, M., Burlaga, L., et al. 1995, SSRv, 71, 207 [Google Scholar]
- Marsch, E., Mühlhäuser, K.-H., Schwenn, R., et al. 1982, JGR, 87, 52 [Google Scholar]
- Maruca, B., Kasper, J., & Bale, S. 2011, PRL, 107, 201101 [Google Scholar]
- Maruca, B. A., Kasper, J. C., & Gary, S. P. 2012, ApJ, 748, 137 [NASA ADS] [CrossRef] [Google Scholar]
- Maruca, B. A., Chasapis, A., Gary, S. P., et al. 2018, ApJ, 866, 25 [Google Scholar]
- Matteini, L., Landi, S., Hellinger, P., et al. 2007, GRL, 34 [Google Scholar]
- Nicolaou, G., Ioannou, C., Owen, C. J., et al. 2025, RSI, 96, 075203 [Google Scholar]
- Nieves-Chinchilla, T., Jian, L. K., Balmaceda, L., et al. 2019, Sol. Phy., 294, 89 [Google Scholar]
- Ogilvie, K., Chornay, D., Fritzenreiter, R., et al. 1995, SSRv, 71, 55 [Google Scholar]
- Opie, S., Verscharen, D., Chen, C. H. K., et al. 2024, JPP, 90, 905900602 [Google Scholar]
- Qudsi, R. A., Bandyopadhyay, R., Maruca, B. A., et al. 2020, ApJ, 895, 83 [Google Scholar]
- Raghav, A. N., Kule, A., Bhaskar, A., et al. 2018, ApJ, 860, 26 [Google Scholar]
- Raghav, A., Dhamane, O., Shaikh, Z., et al. 2023, ApJ, 945, 64 [Google Scholar]
- Richardson, A. S. 2019, 2019 NRL Plasma Formulary (Washington, DC: NRL) [Google Scholar]
- Sahraoui, F., Goldstein, M., Robert, P., & Khotyaintsev, Y. V. 2009, PRL, 102, 231102 [Google Scholar]
- Shaaban, S., Lazar, M., Poedts, S., & Elhanbaly, A. 2017, Ap&SS, 362, 1 [NASA ADS] [CrossRef] [Google Scholar]
- Shaikh, Z. I. 2024, MNRAS, 530, 3005 [Google Scholar]
- Shaikh, Z. I., Raghav, A. N., & Vasko, I. Y. 2023, ApJ, 955, L5 [Google Scholar]
- Shaikh, Z. I., Verscharen, D., Vasko, I. Y., et al. 2024, ApJ, 974, 249 [Google Scholar]
- Siu-Tapia, A., Blanco-Cano, X., Kajdic, P., et al. 2015, JGR, 120, 2363 [Google Scholar]
- Southwood, D. J., & Kivelson, M. G. 1993, JGR, 98, 9181 [Google Scholar]
- Vafin, S., Riazantseva, M., & Pohl, M. 2019, ApJ, 871, L11 [NASA ADS] [CrossRef] [Google Scholar]
- Verscharen, D., Bourouaine, S., & Chandran, B. D. 2013, ApJ, 773, 163 [Google Scholar]
- Verscharen, D., Chen, C. H., & Wicks, R. T. 2017, ApJ, 840, 106 [NASA ADS] [CrossRef] [Google Scholar]
- Verscharen, D., Klein, K. G., & Maruca, B. A. 2019, Liv. Rev. Sol. Phys., 16, 5 [Google Scholar]
- Walters, J., Klein, K. G., Lichko, E., et al. 2023, ApJ, 955, 97 [Google Scholar]
- Yoon, P. H. 2016, JGR, 121, 10 [Google Scholar]
- Yoon, P. H. 2017, Rev. Mod. Plasma Phys., 1, 4 [NASA ADS] [CrossRef] [Google Scholar]
- Yoon, P. H., Lazar, M., Salem, C., et al. 2024, ApJ, 969, 77 [NASA ADS] [CrossRef] [Google Scholar]
- Zhao, L. L., Zank, G. P., He, J. S., et al. 2021, A&A, 656, A3 [NASA ADS] [CrossRef] [EDP Sciences] [Google Scholar]
wind.nasa.gov/ICME_catalog/ICME_catalog_viewer.php (retrieved in April 2023).
https://cdaweb.gsfc.nasa.gov/pub/data/wind/ (retrieved in January 2024).
Appendix A: Magnetic field fluctuations
We compute the level of magnetic fluctuations as root mean square (RMS) magnetic fluctuation, δBrms, using the three magnetic field components as  , where i = (x, y, z), Ntotal is number of data points in MO interval, and ⟨·⟩ denotes the mean over the MO interval. Thus, resultant magnetic fluctuation is
  . The mean magnetic field magnitude, B0, is defined as:
  . The normalised parameter, δBrms/B0, measures magnetic field fluctuations relative to the background field. Thus, we do not compute an average of δB/B over the MO interval. Instead, we determine the background field as a mean vector magnetic field using the full MO interval, and then calculate the RMS magnetic fluctuations.
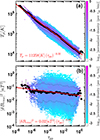 |
Fig. A.1. (a) 2D histogram showing the bin-wise normalised probability density of proton temperature Tp vs collisional age, τpp. The black-filled circles indicate the median Tp values in each τpp bin, while the dashed lines represent the 15th and 85th percentiles. The red line shows a power-law fit to the median trend, with the fitted scaling exponent indicated. (b) Similar 2D histogram of the magnetic fluctuation power |δBrms|2 vs τpp. The median and percentile statistics as well as the power-law fit are shown. |
Figure A.1 shows the variation of proton temperature (Tp) and magnetic fluctuation amplitude (|δBrms|2) with collisional age (τpp). In panel (a), Tp decreases with increasing τpp, while panel (b) shows a weak dependence of |δBrms|2 on τpp. To examine trends, data are binned by τpp, and median values with 15th–85th percentile bars are plotted as circles. The binned medians reveal a strong anti-correlation between Tp and τpp, and a weaker one between |δBrms|2 and τpp. Least-squares power-law fits to the data are also shown in panels (a)–(b). The best-fit lines describing the correlation of the Tp with τpp are
![Mathematical equation: $$ \begin{aligned} T_p \approx 11258\;[K]\; \tau _{pp}^{-0.30}, \end{aligned} $$](/articles/aa/full_html/2026/01/aa55506-25/aa55506-25-eq13.gif) (A.1)
(A.1)
while corresponding best-fit lines for the |δBrms|2 are
![Mathematical equation: $$ \begin{aligned} |\delta B_{rms}|^2 \approx 0.02\;[nT^2]\; \tau _{pp}^{-0.08}. \end{aligned} $$](/articles/aa/full_html/2026/01/aa55506-25/aa55506-25-eq14.gif) (A.2)
(A.2)
The observed datapoints and the best-fit lines demonstrate trends nearly identical to those revealed by the bin median values. Moreover, the estimated τpp includes the Coulomb logarithm, which itself depends on the proton temperature Tp (see Eq. B.3). Therefore, the relationship between Tp and τpp may be inherently influenced by this dependency. The fit shown in Figure A.1 does not explicitly account for uncertainties in the Tp measurements (Nicolaou et al. 2025). We acknowledge that systematic errors in the temperature measurements can affect the slope and intercept of the fit, potentially reducing the observed correlation strength, however, the statistical or random uncertainties are adequately accounted.
Appendix B: Proton-proton collision frequency
We used the NRL Plasma Formulary to estimate collision frequency in a bi-Maxwellian plasma, neglecting effects from relative drifts and secondary proton beams. Temperature anisotropy relaxes via collisions as described in (Richardson 2019).
 (B.1)
(B.1)
where,
 (B.2)
(B.2)
νpp, mp, and e are the proton-proton collision frequency, proton mass, and elementary charge; lnΛ is the Coulomb logarithm,
![Mathematical equation: $$ \begin{aligned} ln \Lambda = 23 - ln \left[ \frac{(2\ N_p)^{1/2}}{T_p^{3/2}}\right], \end{aligned} $$](/articles/aa/full_html/2026/01/aa55506-25/aa55506-25-eq17.gif) (B.3)
(B.3)
and the quantity F is given by
![Mathematical equation: $$ \begin{aligned} F = \frac{1}{A^2} \left[ (A + 3) \frac{\tan ^{-1} \sqrt{A}}{\sqrt{A}} - 3 \right], \end{aligned} $$](/articles/aa/full_html/2026/01/aa55506-25/aa55506-25-eq18.gif) (B.4)
(B.4)
if A > 0; and
![Mathematical equation: $$ \begin{aligned} F = \frac{1}{A^2} \left[ (A + 3) \frac{\tanh ^{-1} \sqrt{-A}}{\sqrt{-A}} - 3 \right], \end{aligned} $$](/articles/aa/full_html/2026/01/aa55506-25/aa55506-25-eq19.gif) (B.5)
(B.5)
if A < 0 and when Tp⊥ ≈ Tp∥ ≡ Tp,  , where
  (Yoon et al. 2024), the collisional age
  estimates how many collisions a plasma parcel undergoes during its travel from the Sun to 1 au (L = 1 au; Vsw is the solar wind speed), where higher densities result in more frequent collisions (Bale et al. 2009; Hellinger & Trávníček 2014).
Appendix C: Wind/SWE instrument note
The Wind/SWE instrument uses Faraday cups to measure ions over an energy-per-charge range of 150 V to 8 kV. It operates in two energy-resolution modes: a narrow band (ΔE/E ∼ 0.065) and a double band (ΔE/E ∼ 0.135). During the early years of the mission, 31 velocity windows were used in the double-band mode. Later, a ’peak-tracking’ algorithm was introduced, making the narrow band the default with 14 velocity windows, while every tenth ion spectrum still uses the double band for reference (Ogilvie et al. 1995). The resolution is sufficient for solar wind conditions where the flow is nearly radial, though small biases (∼8%, (Kasper et al. 2002, 2006)) in temperature anisotropy may occur when the inflow deviates from the instrument’s aperture or under strongly anisotropic conditions, warrant future quantitative assessment (Nicolaou et al. 2025). A more detailed study of this instrumental effect will be carried out in future studies.
All Figures
|
Fig. 1. Probability density distribution of (a) proton temperature (Tp) and its components (Tp∥ and Tp⊥); and (b) proton beta (βp) with its parallel (βp∥) and perpendicular (βp⊥) components, observed during all 382 ICME MOs. The mean ( |
| In the text | |
|
Fig. 2. Plots of bin-median (a) Tp, (b) Tp⊥, and (c) Tp∥ in the (βp∥, Rp) plane. The over-plotted curves represent instability thresholds, as seen in Figure 1c. The increase in Tp occurs near or beyond the PC and OF instability thresholds, with Tp⊥ enhanced beyond the OF threshold and Tp∥ beyond the PC threshold for βp∥ > 1. Bins with less than 15 data points are shown in grey, denoting regions of low statistical significance. |
| In the text | |
|
Fig. 3. Plot of bin-median (a) collisional age (τpp) and (b) magnetic fluctuation amplitude (δBrms/Bo) in the (βp∥, Rp) plane. The τpp is highest around Rp ∼ 1, suggesting that the plasma is largely isotropised by Coulomb collisions, and that anisotropic plasma is mostly collisionless. The δBrms/Bo shows enhancement in the vicinity of the instability thresholds and at the high βp∥ > 1. |
| In the text | |
|
Fig. A.1. (a) 2D histogram showing the bin-wise normalised probability density of proton temperature Tp vs collisional age, τpp. The black-filled circles indicate the median Tp values in each τpp bin, while the dashed lines represent the 15th and 85th percentiles. The red line shows a power-law fit to the median trend, with the fitted scaling exponent indicated. (b) Similar 2D histogram of the magnetic fluctuation power |δBrms|2 vs τpp. The median and percentile statistics as well as the power-law fit are shown. |
| In the text | |
Current usage metrics show cumulative count of Article Views (full-text article views including HTML views, PDF and ePub downloads, according to the available data) and Abstracts Views on Vision4Press platform.
Data correspond to usage on the plateform after 2015. The current usage metrics is available 48-96 hours after online publication and is updated daily on week days.
Initial download of the metrics may take a while.