Fig. 4.
Download original image
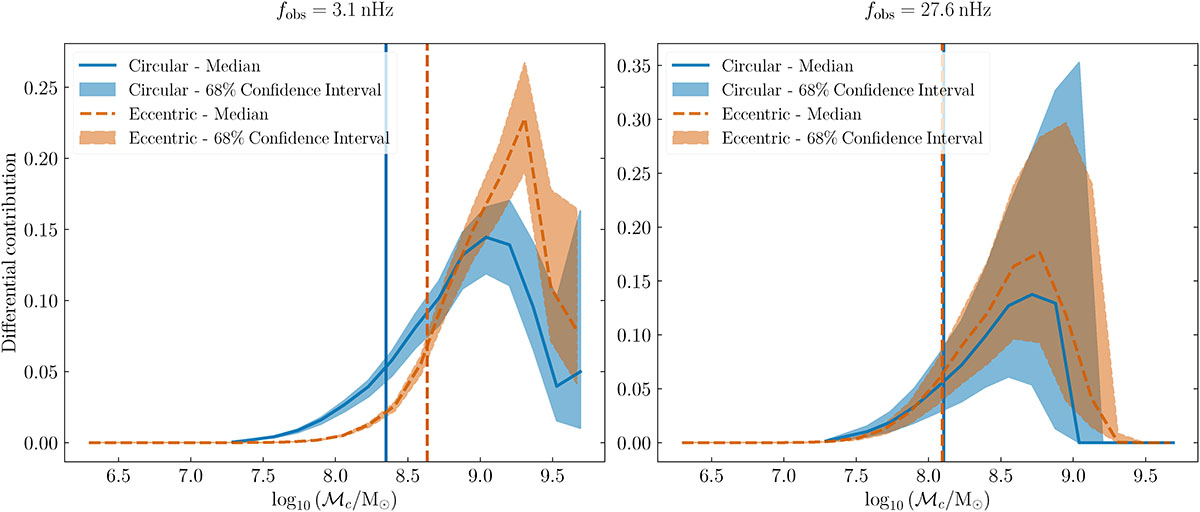
Median and 68% confidence interval of the differential contribution to the total characteristic strain signal, based on 2000 Universe realizations, shown across MBHB log10-chirp mass bins for both circular and eccentric populations. We compare the results at two observer frequencies: 3.1 nHz (left panel) and 27.6 nHz (right panel). Vertical lines represent the median chirp mass value at which the cumulative contribution (integrating from lower masses) reaches 10% of the total strain signal for the circular (solid line) and eccentric (dashed line) populations.
Current usage metrics show cumulative count of Article Views (full-text article views including HTML views, PDF and ePub downloads, according to the available data) and Abstracts Views on Vision4Press platform.
Data correspond to usage on the plateform after 2015. The current usage metrics is available 48-96 hours after online publication and is updated daily on week days.
Initial download of the metrics may take a while.