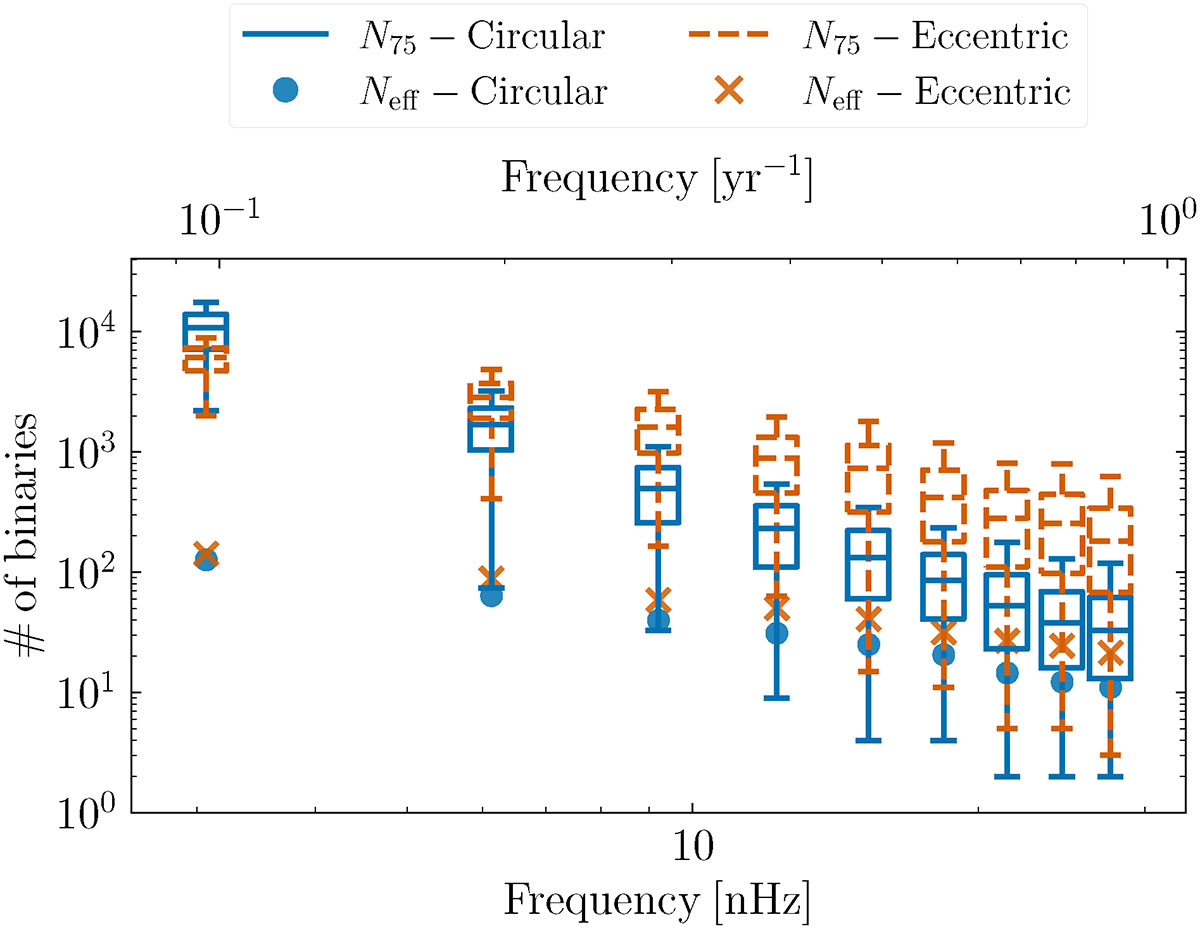
Fig. 5.
Download original image
Comparison of the effective number of binaries in terms of N75 and Neff contributing to the GWB at each observed frequency bin of a PTA with an observing duration of 10.3 years as for EPTA Collaboration (2023a). At each observer frequency, the two extreme horizontal lines represent the 5th and 95th quartiles of the N75 distribution, derived from 2000 Universe realizations. The edges and the central line of the box represent the 25th, 50th, and 75th quartiles, respectively. For Neff, we only show the median of the distribution at each observer frequency with blue dots for the circular population and orange crosses for the eccentric population.
Current usage metrics show cumulative count of Article Views (full-text article views including HTML views, PDF and ePub downloads, according to the available data) and Abstracts Views on Vision4Press platform.
Data correspond to usage on the plateform after 2015. The current usage metrics is available 48-96 hours after online publication and is updated daily on week days.
Initial download of the metrics may take a while.