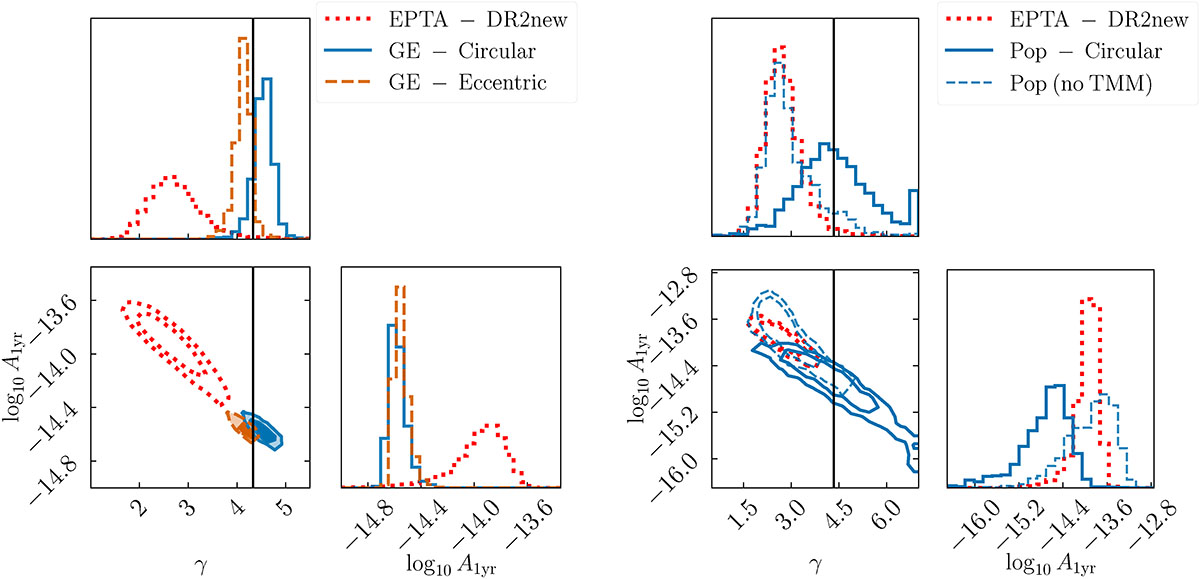
Fig. 6.
Download original image
Distributions of the amplitude Ayr at fyr and the spectral index γ, which parameterize the GWB timing residuals PSD, derived from 2000 Universe realizations, are compared with the EPTA results (red dotted contours) of EPTA Collaboration (2023a). The 68% and 90% confidence regions are shown for all distributions. Left panel: Distributions obtained via power-law least-squares fits to spectra from the Gaussian ensemble (GE) method for the circular (blue) and eccentric (orange) populations are shown as filled contours. Right panel: Distributions of maximum-a-posteriori power-law parameters from PTA-like inference using the GWB timing residuals from the population (Pop) approach. Solid contours represent the standard data analysis procedure that includes TMM; dashed contours represent the analysis without TMM. The effects of spectral leakage on the inference are clearly visible without TMM and remain measurable even when TMM is included. In both panels, the expected spectral index, γ = 13/3, of the average spectrum from a population of circular binaries driven by GW emission, is shown as a black vertical line. Note: γ relates to the characteristic strain spectral index α via γ = 3 − 2α.
Current usage metrics show cumulative count of Article Views (full-text article views including HTML views, PDF and ePub downloads, according to the available data) and Abstracts Views on Vision4Press platform.
Data correspond to usage on the plateform after 2015. The current usage metrics is available 48-96 hours after online publication and is updated daily on week days.
Initial download of the metrics may take a while.