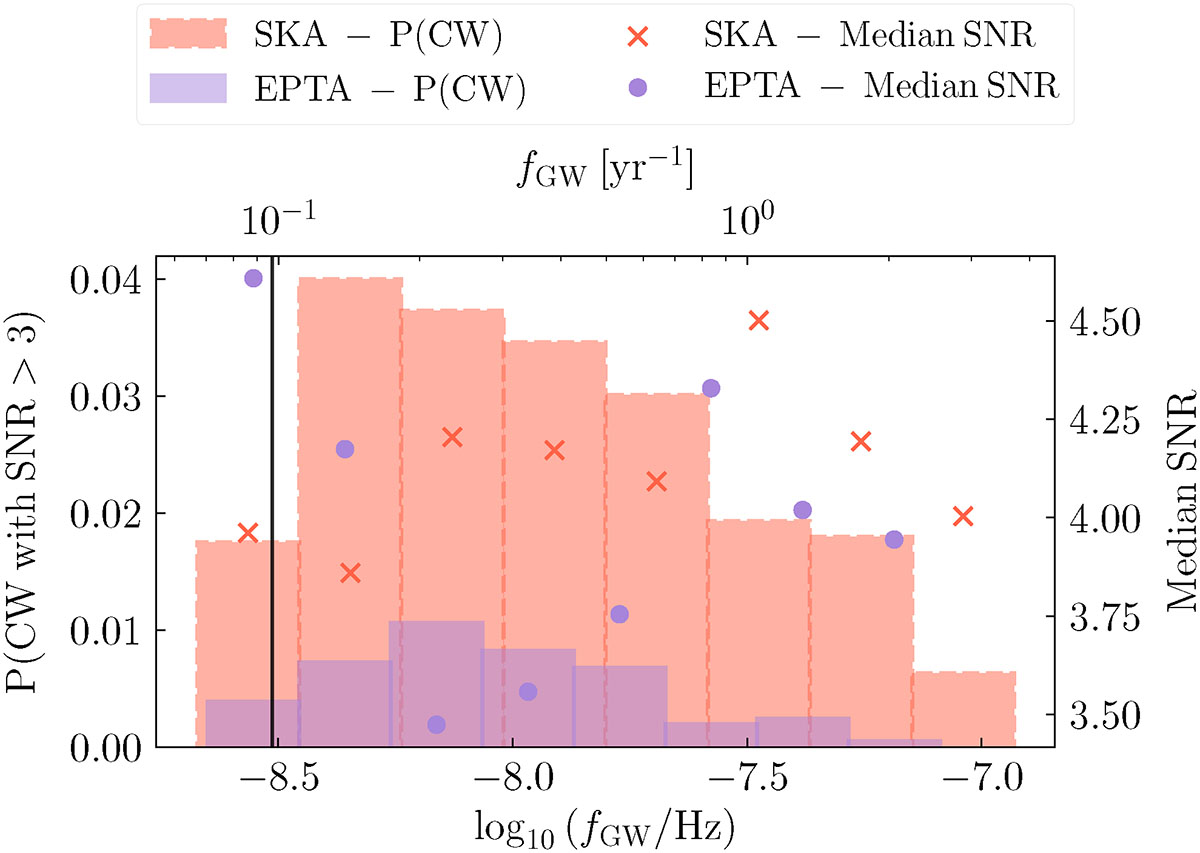
Fig. 8.
Download original image
Probability of detecting a Continuous Wave (CW) signal from an individual MBH binary with a GW frequency in a given range, with an S/N greater than 3 for two toy PTAs representing the EPTA and the future SKA. Probabilities, shown as histograms, are derived from 2000 Universe realizations. The medians of the S/N distributions in each GW frequency band are overlaid, shown with dots (EPTA) and crosses (SKA). The frequency associated with the observation duration of the PTAs (10.33 years) is shown as a black vertical line.
Current usage metrics show cumulative count of Article Views (full-text article views including HTML views, PDF and ePub downloads, according to the available data) and Abstracts Views on Vision4Press platform.
Data correspond to usage on the plateform after 2015. The current usage metrics is available 48-96 hours after online publication and is updated daily on week days.
Initial download of the metrics may take a while.