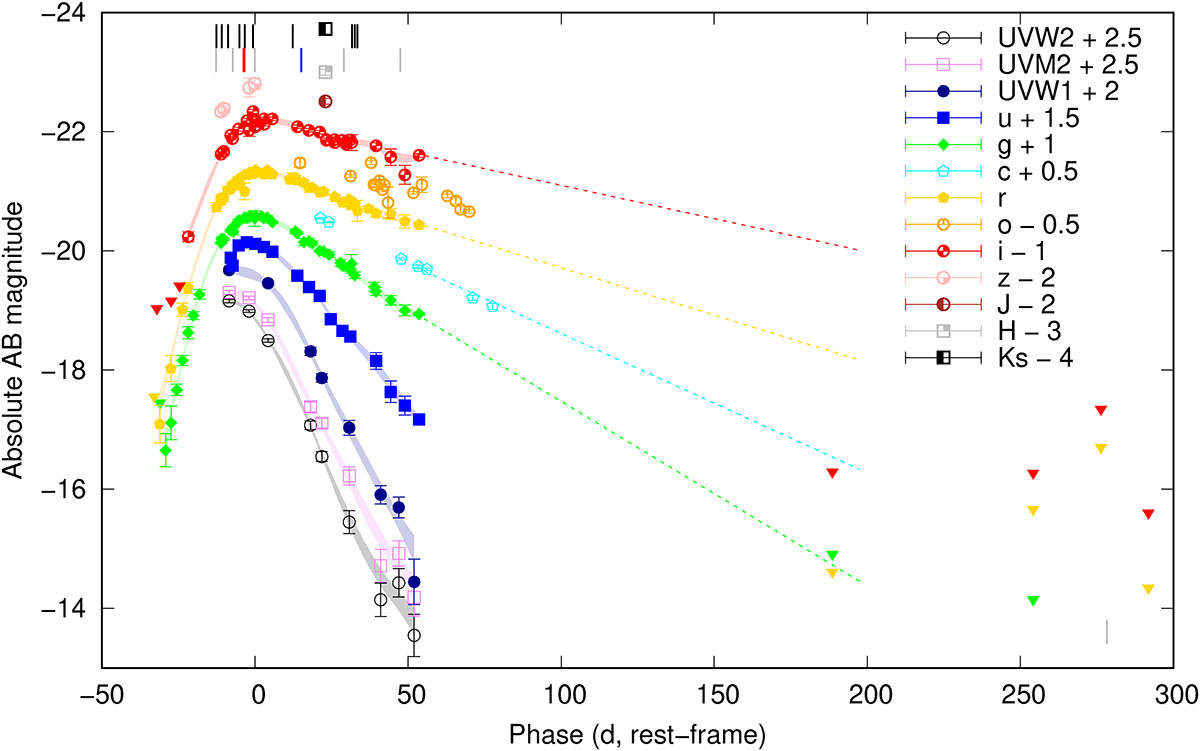
Fig. 2.
Download original image
Light curve of SN 2023gpw. The zero epoch corresponds to the g-band peak on MJD = 60085.0. Triangles denote 3σ upper limits, and shaded regions denote 1σ uncertainties of our GP fits. Epochs of spectra are marked with black (SEDM), gray (our other spectra) or blue (Kravtsov et al. 2023) lines, and the epoch of polarimetry is marked with a red line. Dashed lines show the evolution if the pre-gap decline rates had stayed constant during the gap, showing that the decline must have steepened some time after the last detection in the r and i bands.
Current usage metrics show cumulative count of Article Views (full-text article views including HTML views, PDF and ePub downloads, according to the available data) and Abstracts Views on Vision4Press platform.
Data correspond to usage on the plateform after 2015. The current usage metrics is available 48-96 hours after online publication and is updated daily on week days.
Initial download of the metrics may take a while.