Open Access
Fig. 7.
Download original image
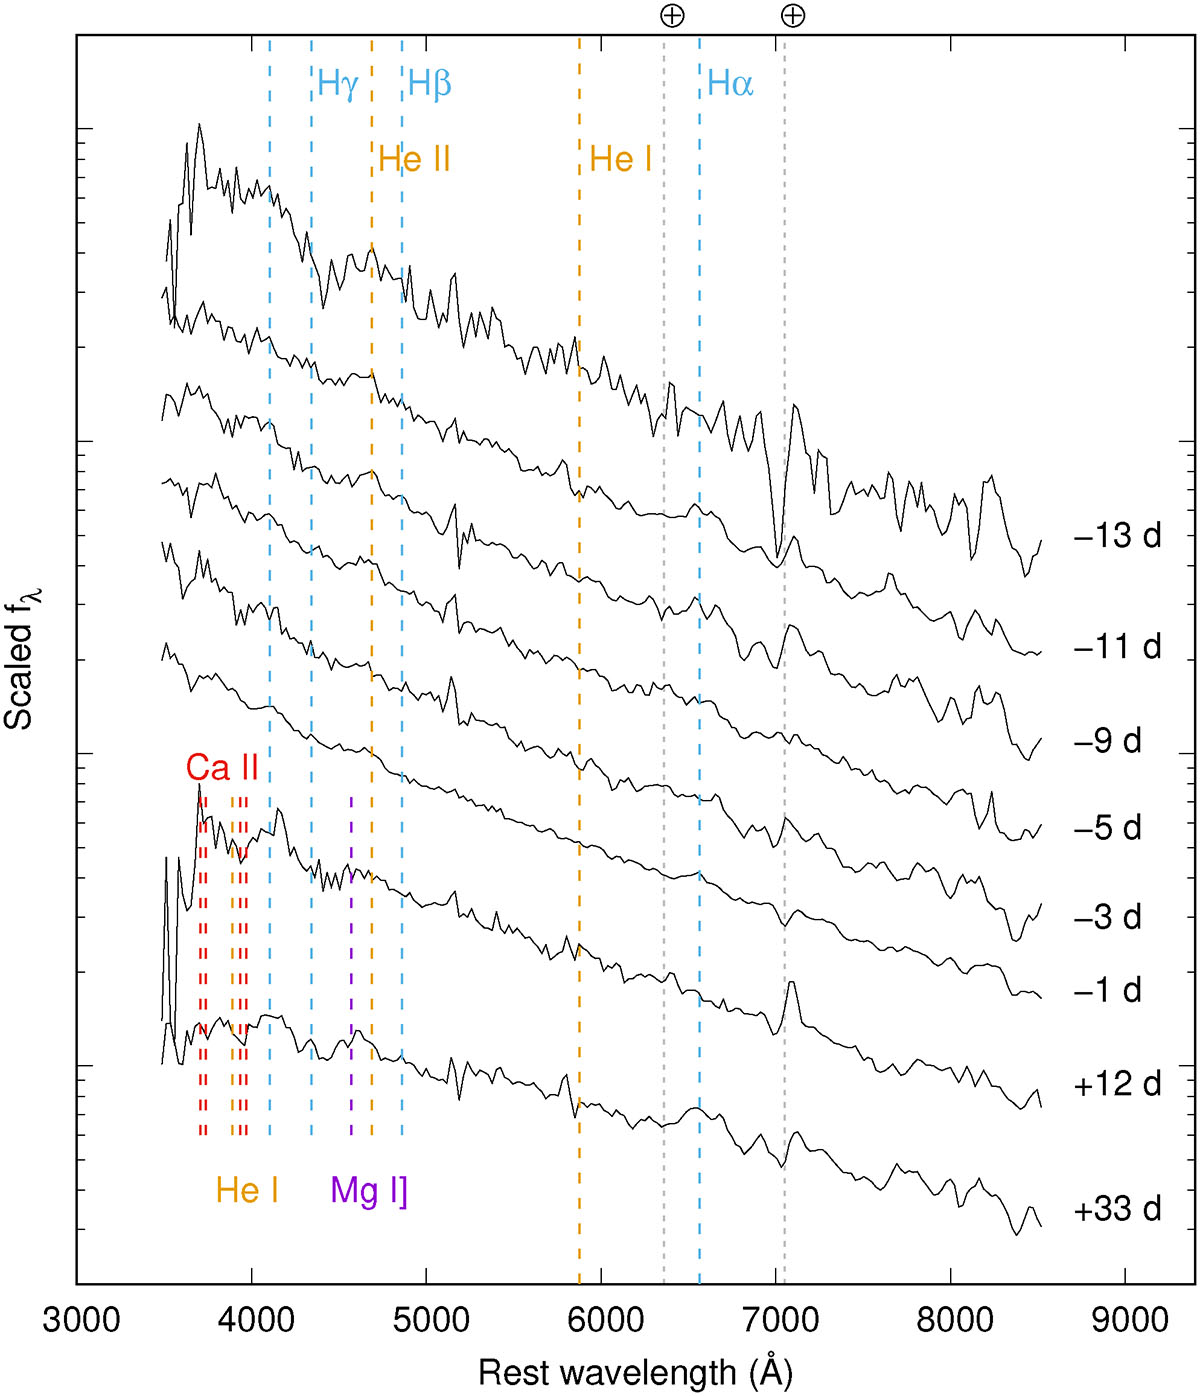
Low-resolution SEDM spectra of SN 2023gpw. The zero epoch corresponds to the g-band peak on MJD = 60085.0. Telluric absorption lines (⨁) are marked in vertical dotted lines. The marked lines are based on the higher-resolution spectra; the Ca II lines do not seem to match observed features here.
Current usage metrics show cumulative count of Article Views (full-text article views including HTML views, PDF and ePub downloads, according to the available data) and Abstracts Views on Vision4Press platform.
Data correspond to usage on the plateform after 2015. The current usage metrics is available 48-96 hours after online publication and is updated daily on week days.
Initial download of the metrics may take a while.