Fig. 2.
Download original image
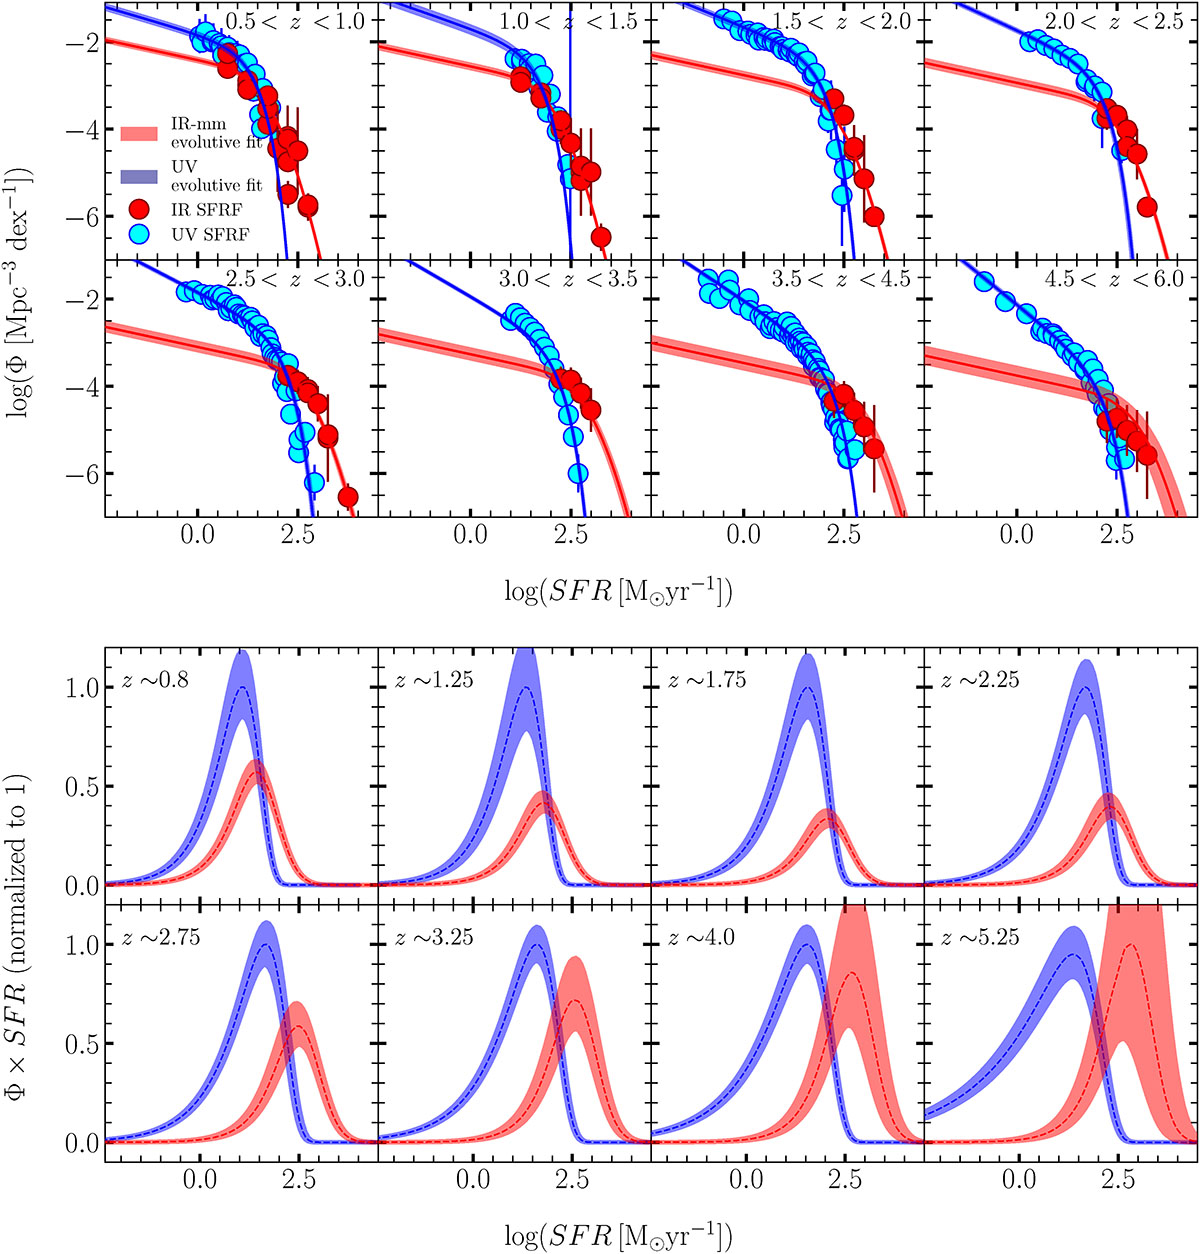
Upper panel: UV and IR SFRFs at different redshifts. Data points are plotted in cyan (UV) and red (IR), with best-fit curves shown as blue (UV) and red (IR). Lower panel: Product of volume density (Φ) and SFR in each redshift bin, which is integrated to obtain the SFRD. The UV (blue area) and the IR (red area) SFR density distributions are compared at different redshifts as a function of the SFR. Both curves are normalized so that the UV peak is at 1.
Current usage metrics show cumulative count of Article Views (full-text article views including HTML views, PDF and ePub downloads, according to the available data) and Abstracts Views on Vision4Press platform.
Data correspond to usage on the plateform after 2015. The current usage metrics is available 48-96 hours after online publication and is updated daily on week days.
Initial download of the metrics may take a while.