Open Access
Fig. 3.
Download original image
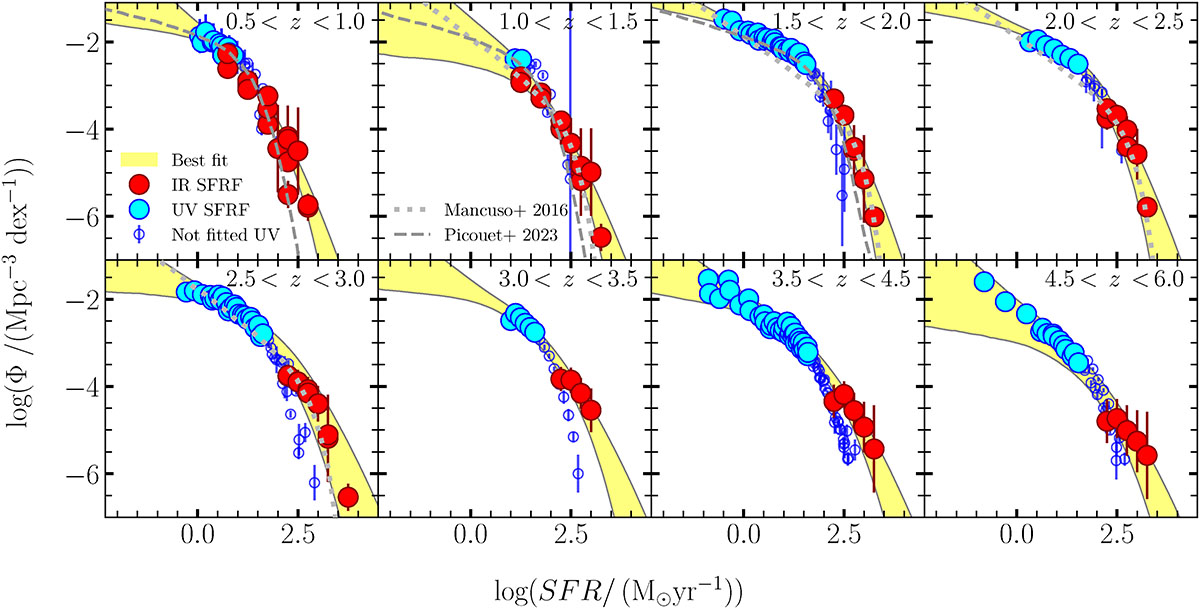
Combined SFRF best-fit. The UV and IR data points are the same as in Figure 2. Open blue circles indicate the UV points excluded from the combined fit. The combined best-fit is shown as a yellow shaded region, corresponding to the 16th and 84th percentiles from the MCMC analysis.
Current usage metrics show cumulative count of Article Views (full-text article views including HTML views, PDF and ePub downloads, according to the available data) and Abstracts Views on Vision4Press platform.
Data correspond to usage on the plateform after 2015. The current usage metrics is available 48-96 hours after online publication and is updated daily on week days.
Initial download of the metrics may take a while.