Fig. 7.
Download original image
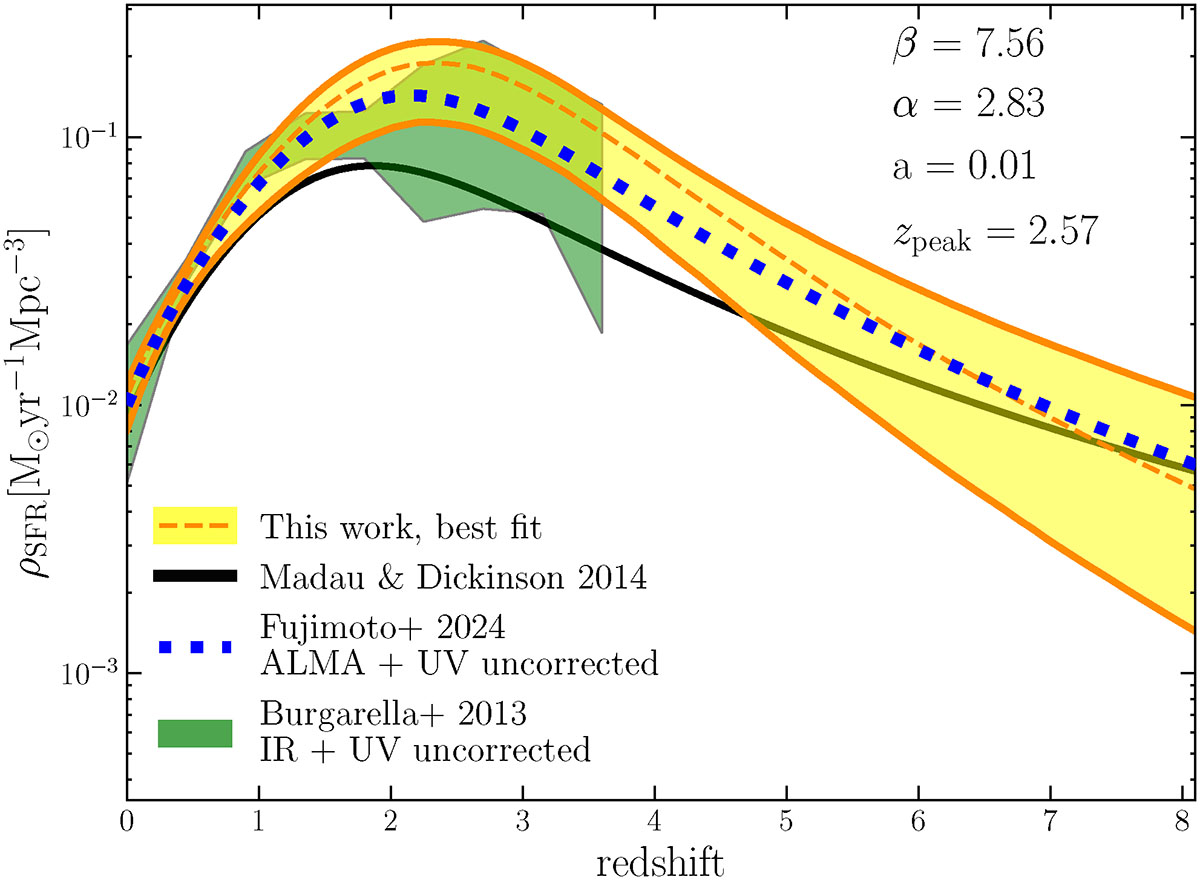
Fit to the total SFRD using the functional form by Madau & Dickinson (2014). The best fit to our data is shown as the dashed orange line with yellow error bands. The Madau & Dickinson (2014) fit is plotted in black. A similar fit from Fujimoto et al. (2024) is shown as the dotted blue line, while the shaded green area represents the combined SFRD estimated by Burgarella et al. (2013). In the upper-right corner, we display the best-fit values of the free parameters of Equation (11).
Current usage metrics show cumulative count of Article Views (full-text article views including HTML views, PDF and ePub downloads, according to the available data) and Abstracts Views on Vision4Press platform.
Data correspond to usage on the plateform after 2015. The current usage metrics is available 48-96 hours after online publication and is updated daily on week days.
Initial download of the metrics may take a while.