Fig. 1
Download original image
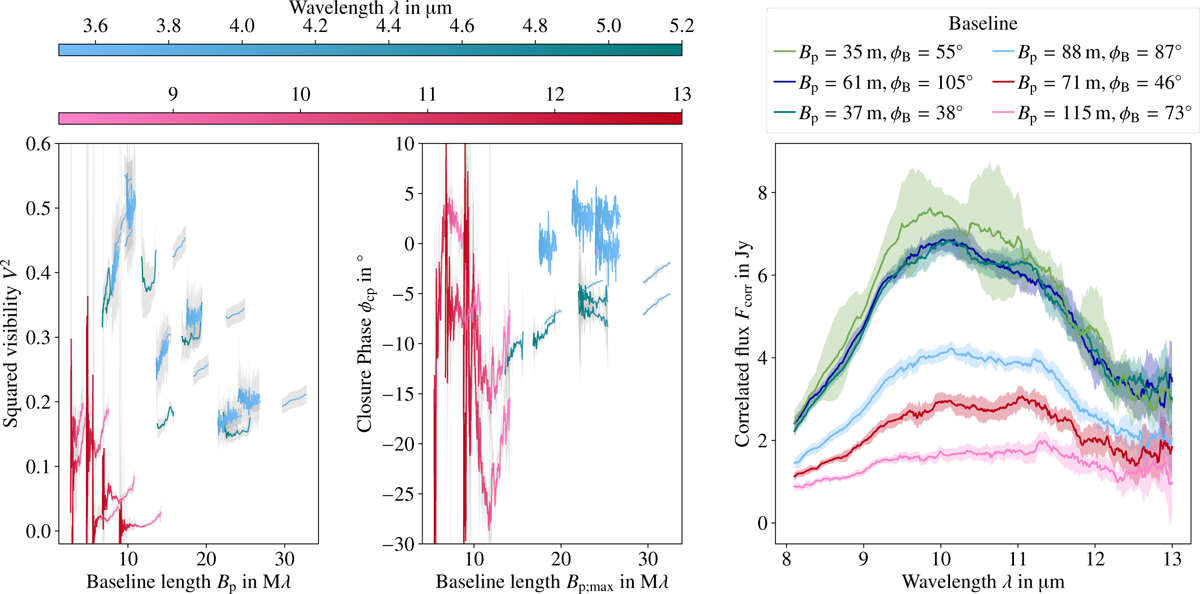
Overview of the MATISSE observations of RY Tau listed in Table 1. The corresponding u–v coordinates are shown in Fig. 4. Left panel: Squared visibilities, V2, over projected baseline length Bp (pink/red: 8–13 μm wavelengths; blue/green: 3.5–5.2 μm wavelengths; see color bars). Middle panel: Measured closure phases, ϕcp, over the longest projected baseline length in the telescope triplet, Bp;max. Right panel: Correlated fluxes, Fcorr, and corresponding projected baseline length, Bp, and orientation, ϕB, in the N band.
Current usage metrics show cumulative count of Article Views (full-text article views including HTML views, PDF and ePub downloads, according to the available data) and Abstracts Views on Vision4Press platform.
Data correspond to usage on the plateform after 2015. The current usage metrics is available 48-96 hours after online publication and is updated daily on week days.
Initial download of the metrics may take a while.