Fig. A.4
Download original image
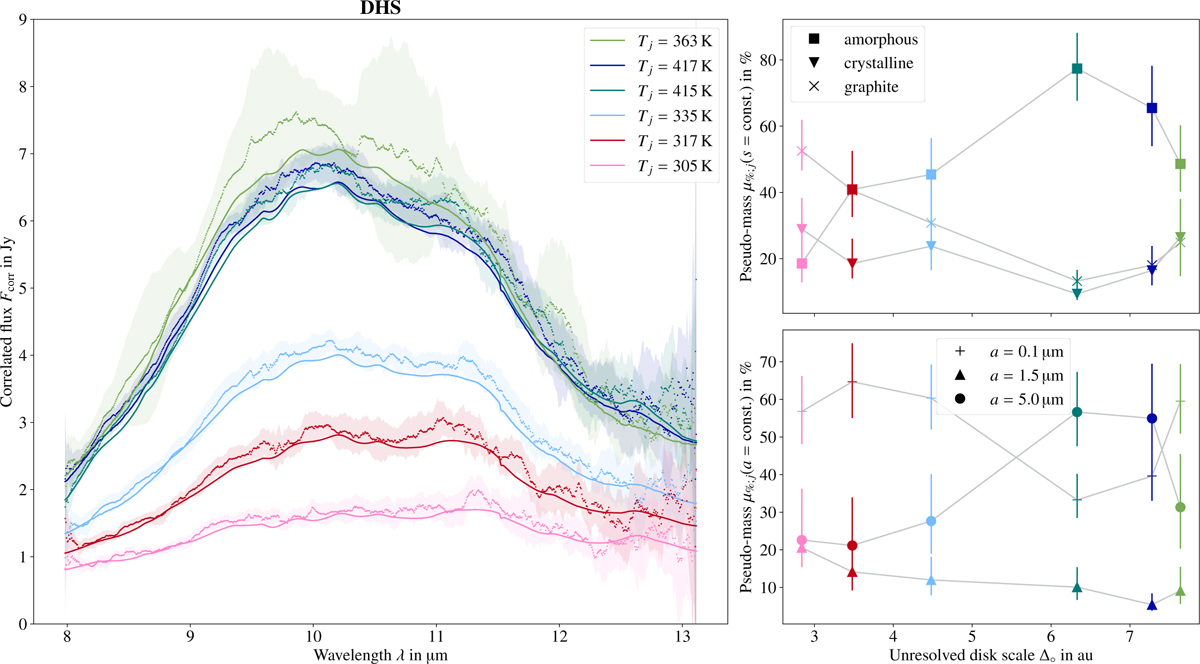
Best-fit model for the dust opacity model assuming a distribution of hollow spheres. Left: Comparison of measured and fitted correlated fluxes for the N-band baselines. Upper right: Trends of relative mass contribution of materials depending on their internal structure over unresolved disk scale. Lower right: Trends of grain size over unresolved disk scale.
Current usage metrics show cumulative count of Article Views (full-text article views including HTML views, PDF and ePub downloads, according to the available data) and Abstracts Views on Vision4Press platform.
Data correspond to usage on the plateform after 2015. The current usage metrics is available 48-96 hours after online publication and is updated daily on week days.
Initial download of the metrics may take a while.