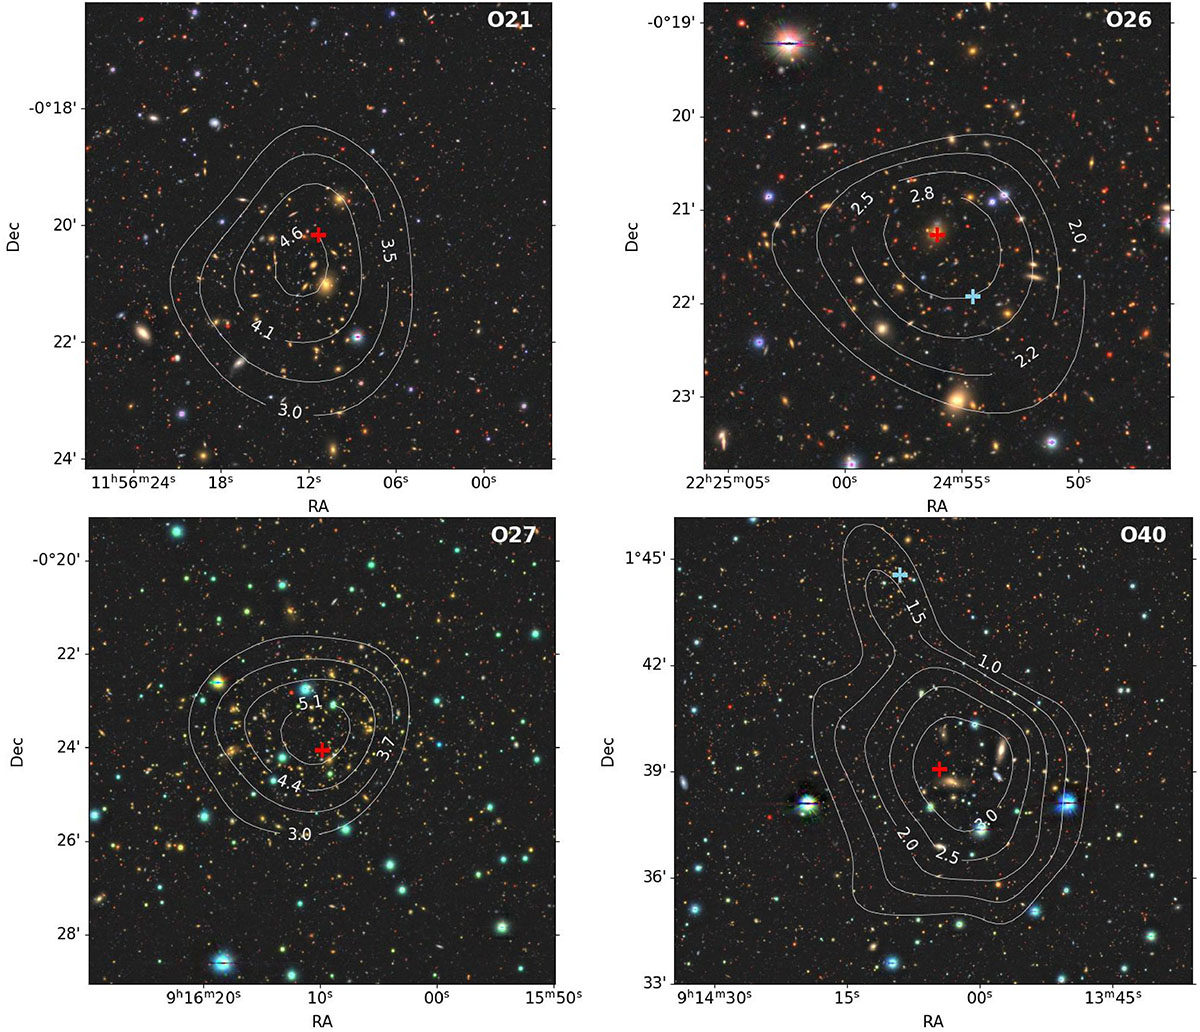
Fig. 1.
Download original image
True-color (grz) HSC images with overlaid contours of the weak-lensing S-map, serving as a proxy for signal-to-noise, convolved with a Gaussian filter of σ = 2 arcmin for display purposes. The red and cyan crosses mark the positions of the target cluster and other clusters (present in O26 and O40 panels), respectively. The true-color images are taken from https://www.legacysurvey.org/viewer.
Current usage metrics show cumulative count of Article Views (full-text article views including HTML views, PDF and ePub downloads, according to the available data) and Abstracts Views on Vision4Press platform.
Data correspond to usage on the plateform after 2015. The current usage metrics is available 48-96 hours after online publication and is updated daily on week days.
Initial download of the metrics may take a while.