Open Access
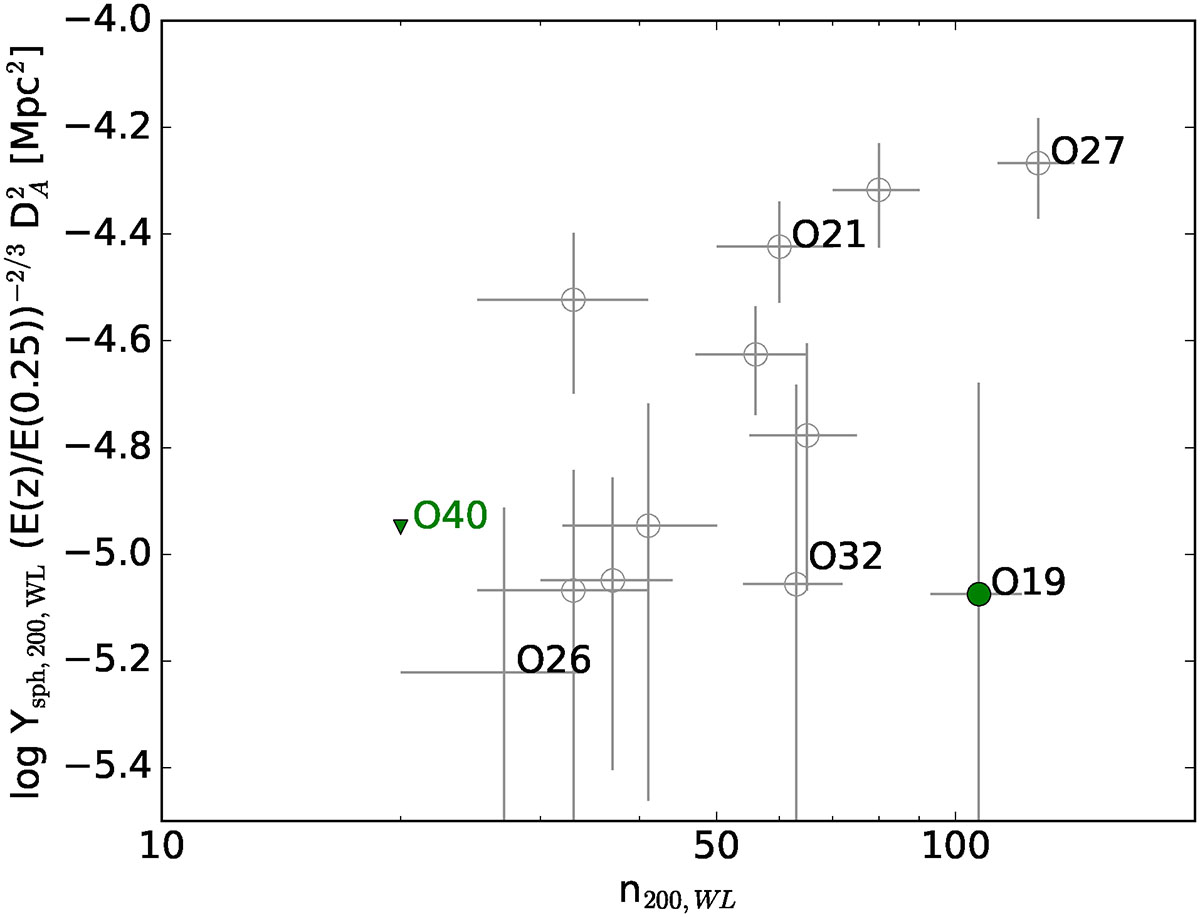
Fig. 10.
Download original image
Compton Y-richness scaling relation within r200, WL. The green point and upper limit represent Compton Y–mass outliers. The data do not delineate a clear trend. Clusters discussed in the text are labeled.
Current usage metrics show cumulative count of Article Views (full-text article views including HTML views, PDF and ePub downloads, according to the available data) and Abstracts Views on Vision4Press platform.
Data correspond to usage on the plateform after 2015. The current usage metrics is available 48-96 hours after online publication and is updated daily on week days.
Initial download of the metrics may take a while.