Fig. 11.
Download original image
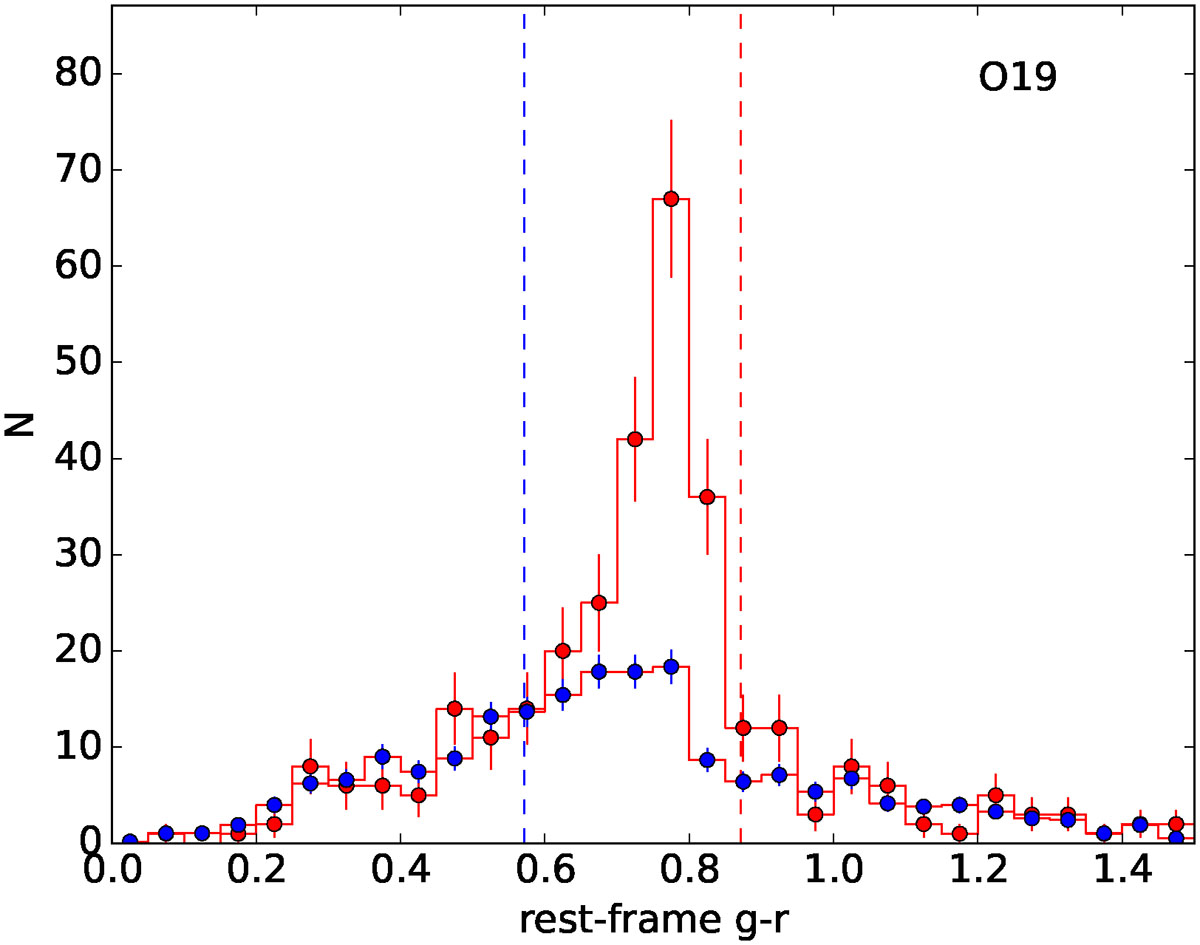
Color distribution of galaxies within ![]() (red histogram) and in a control area (normalized to the solid angle of the cluster, blue histogram) for O19. Only galaxies brighter than MVe = −20 mag are considered, assuming all galaxies are at the O19 redshift. The vertical lines indicate the expected color range of the red sequence. The single peak in the color distributions confirms the absence of a substantial contamination by other structures, as shown through spectroscopic data and the color-magnitude distribution in Paper II.
(red histogram) and in a control area (normalized to the solid angle of the cluster, blue histogram) for O19. Only galaxies brighter than MVe = −20 mag are considered, assuming all galaxies are at the O19 redshift. The vertical lines indicate the expected color range of the red sequence. The single peak in the color distributions confirms the absence of a substantial contamination by other structures, as shown through spectroscopic data and the color-magnitude distribution in Paper II.
Current usage metrics show cumulative count of Article Views (full-text article views including HTML views, PDF and ePub downloads, according to the available data) and Abstracts Views on Vision4Press platform.
Data correspond to usage on the plateform after 2015. The current usage metrics is available 48-96 hours after online publication and is updated daily on week days.
Initial download of the metrics may take a while.