Fig. 4.
Download original image
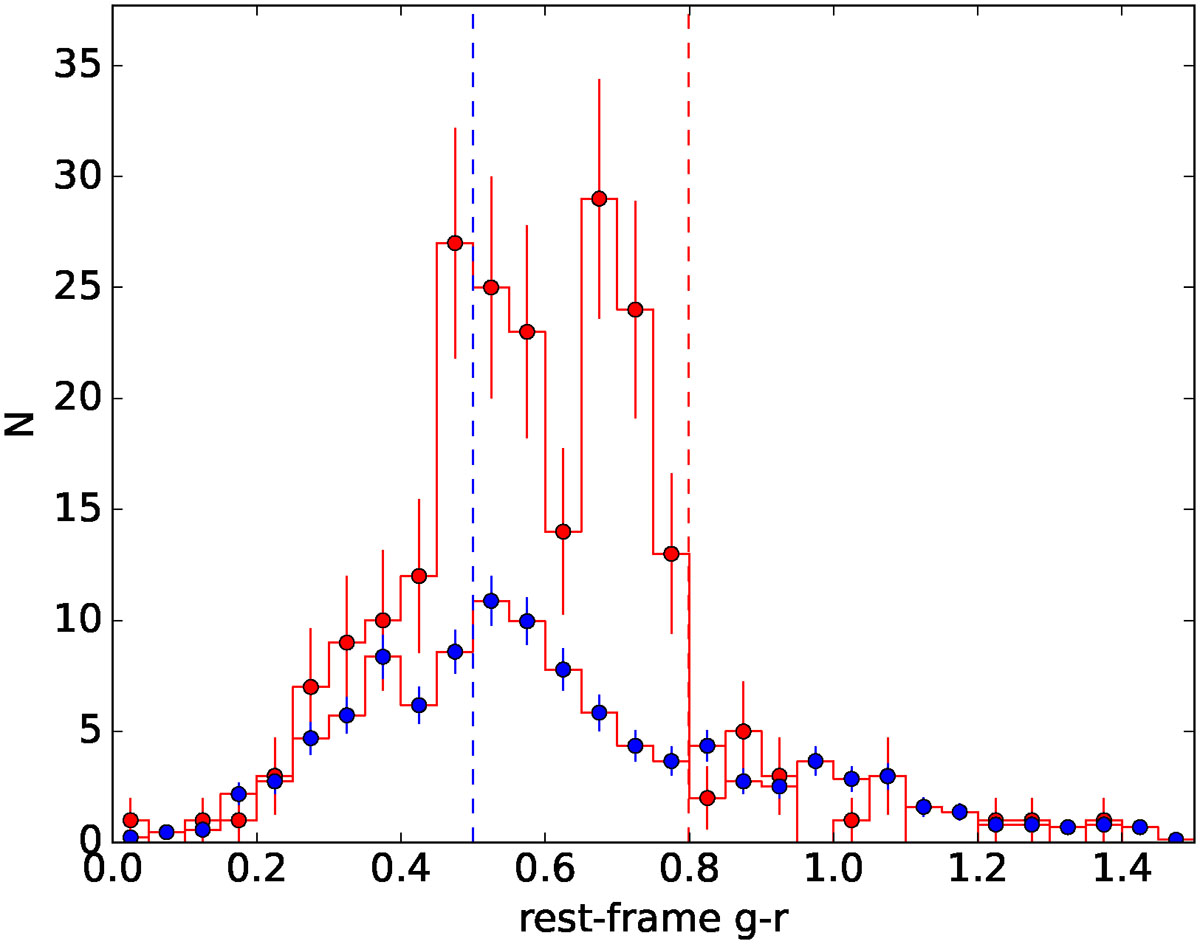
Color distribution of galaxies within r200,wl (red histogram) and in a control area (normalized to the cluster solid angle, blue histogram) for O32. The vertical lines indicate the expected color range of the red sequence. The peak on the right corresponds to the color expected for the cluster redshift, while the second peak represents a contaminating structure along the line of sight spectroscopically confirmed at z = 0.136 (see text for details). For O32, the color range was reduced by 0.1 mag on the blue side to exclude this contamination. Only galaxies brighter than MVe = −20 mag, assuming all galaxies are at the O32 redshift, are considered, which boosts the low redshift contamination.
Current usage metrics show cumulative count of Article Views (full-text article views including HTML views, PDF and ePub downloads, according to the available data) and Abstracts Views on Vision4Press platform.
Data correspond to usage on the plateform after 2015. The current usage metrics is available 48-96 hours after online publication and is updated daily on week days.
Initial download of the metrics may take a while.