Fig. 6.
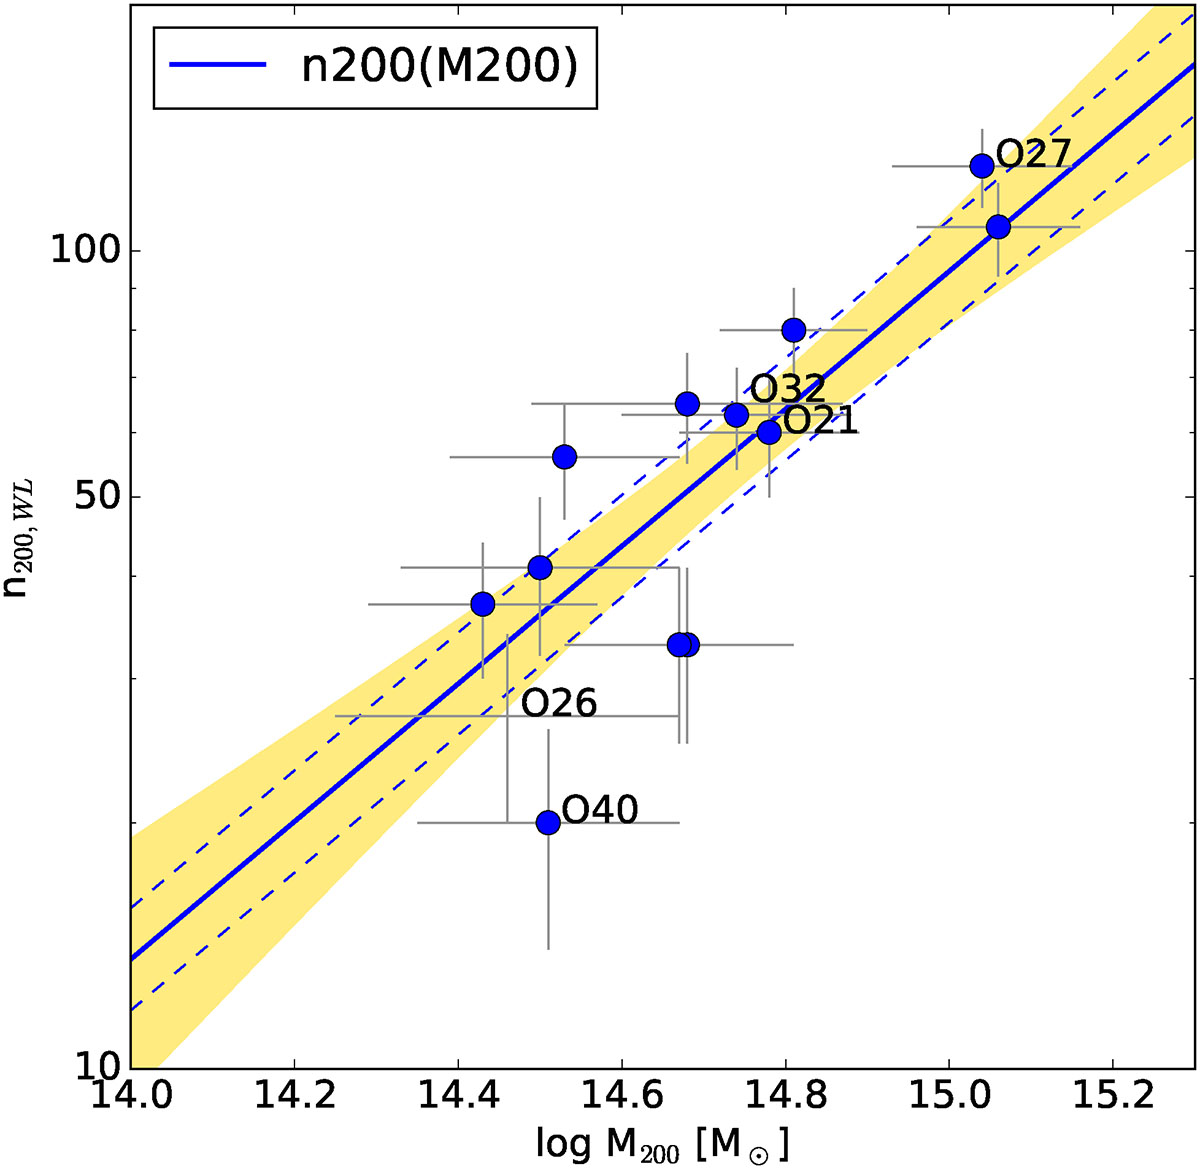
Download original image
Richness vs. mass scaling relation within r200, WL. The solid line with yellow shading represents the mean richness-mass model with 68% uncertainty, while the dashed corridor indicates the mean model ±1 intrinsic scatter. The clusters discussed in the text are labeled. O26 is not fit due to its likely contaminated weak-lensing mass. Including it in the sample would not alter the scaling relation. In this plot and in Fig. 8, richness errors are approximated as Gaussian for plotting purposes, although their exact distributions are properly accounted for in the fit (see text for details).
Current usage metrics show cumulative count of Article Views (full-text article views including HTML views, PDF and ePub downloads, according to the available data) and Abstracts Views on Vision4Press platform.
Data correspond to usage on the plateform after 2015. The current usage metrics is available 48-96 hours after online publication and is updated daily on week days.
Initial download of the metrics may take a while.