Fig. 10
Download original image
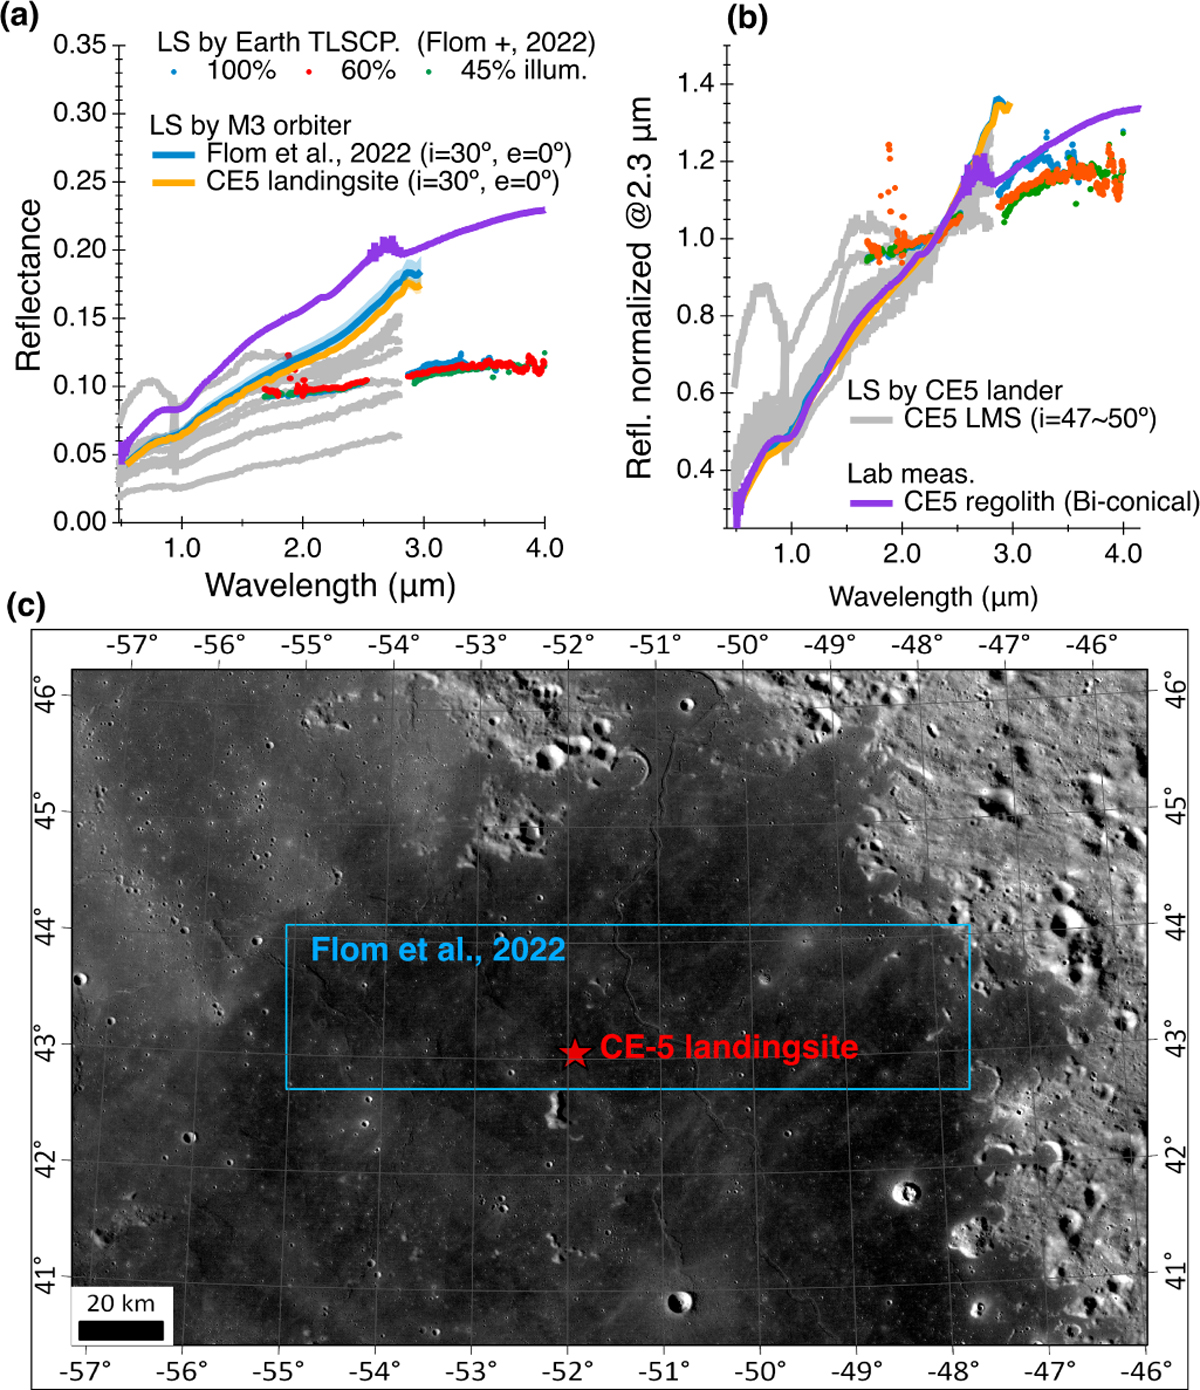
VNIR reflectance spectrum of the CE5 sample and comparison with those of the in situ measurements by the spectrometer (LMS) on board the CE5 lander, the ground-based telescope (TLSCP) observation (Flom et al. 2022), and the orbital data from M3 (Pieters et al. 2009) for the landing site (LS) (6 × 6 pixels), the region sampled in Flom et al. (2022). (a) Reflectance values; (b) Reflectance normalized to 1 at 2.3 μm; (c) Map showing the CE5 landing site and the region approximately where Flom et al. (2022) sampled the spectra. The base map is from the Lunar Reconnaissance Orbiter Camera (Robinson et al. 2010; Wagner et al. 2015).
Current usage metrics show cumulative count of Article Views (full-text article views including HTML views, PDF and ePub downloads, according to the available data) and Abstracts Views on Vision4Press platform.
Data correspond to usage on the plateform after 2015. The current usage metrics is available 48-96 hours after online publication and is updated daily on week days.
Initial download of the metrics may take a while.