| Issue |
A&A
Volume 705, January 2026
|
|
|---|---|---|
| Article Number | A223 | |
| Number of page(s) | 12 | |
| Section | Planets, planetary systems, and small bodies | |
| DOI | https://doi.org/10.1051/0004-6361/202555761 | |
| Published online | 23 January 2026 | |
Bi-directional reflectance, polarization, and spectroscopic measurements of the Chang'e-5 regolith sample
1
School of Earth Sciences and Hubei Key Laboratory of Planetary Geology and Space Explorations, China University of Geosciences,
Wuhan,
China
2
State Key Laboratory of Lunar and Planetary Sciences, Macau University of Science and Technology,
Macau,
China
3
Department of Astronomy and Space Informatics, V. N. Karazin Kharkiv National University,
Kharkiv,
Ukraine
4
University of Hawaii,
Honolulu,
HI,
USA
5
Key Laboratory of Lunar and Deep Space Exploration, National Astronomical Observatories, Chinese Academy of Sciences,
Beijing,
China
6
Department of Physics, University of Central Florida,
Orlando,
FL,
USA
★★ Corresponding author: This email address is being protected from spambots. You need JavaScript enabled to view it.
Received:
31
May
2025
Accepted:
24
October
2025
Abstract
Context. Optical measurement is a powerful tool for retrieving the regolith physical properties of the lunar surface.
Aims. It has been a long-standing question in planetary remote sensing whether laboratory measurements are consistent with remote sensing measurements. The sample return mission of Chang’e-5 (CE5) has provided an opportunity to answer this question.
Methods. For this work we performed photometric, linear and circular polarimetric, and reflectance spectroscopic measurements of the Chang’e-5 surface scooped regolith (soil) sample CE5C0600.
Results. Our results show that the CE5 regolith exhibits both a strong opposition effect and a pronounced forward-scattering lobe, and a moderate contrast between its minimum and maximum reflectance values compared to the in situ measurements of Chang’e-3 and −4. A slight monotonic phase reddening trend is observed with increasing phase angle, while no clear colorimetric opposition effect was found at small phase angles The regolith shows maximum linear polarization at large phase angles, ∼16 at 633 and ∼21% at 532 nm, slightly higher than the values reported in ground-based observations and laboratory measurements on the Apollo and Luna samples. The circular polarization ratio increases as the phase angle decreases, consistent with previous observations of the Apollo samples. Compared with orbital, in situ,and ground-based observations of the CE5 landing site, the laboratory-measured regolith exhibits higher reflectance but a very similar spectral slope, suggesting a higher degree of compaction in the Earth environment.
Conclusions. Studies of lunar samples with varying porosities and space weathering degrees are needed to better understand their behavior under in situ condition, enabling their use as a reliable ground truth for current and future Lunar missions.
Key words: Moon / planets and satellites: composition / planets and satellites: surfaces / planets and satellites: terrestrial planets
Current address: Sorbonne Université, Muséum National d'Histoire Naturelle, UMR CNRS 7590, Institut de Minéralogie, de Physique des Matériaux et de Cosmochimie, Paris, France
Current address: Planetary Environmental and Astrobiological Research Laboratory, School of Atmospheric Sciences, Sun Yat-sen University, Zhuhai
Current address: Institute of Seismology, China Earthquake Administration, Wuhan, China
© The Authors 2026
 Open Access article, published by EDP Sciences, under the terms of the Creative Commons Attribution License (https://creativecommons.org/licenses/by/4.0), which permits unrestricted use, distribution, and reproduction in any medium, provided the original work is properly cited.
This article is published in open access under the Subscribe to Open model. This email address is being protected from spambots. You need JavaScript enabled to view it. to support open access publication.
1 Introduction
The lunar regolith, a layer of loose fragmented material covering solid bedrock, holds critical information about the Moon’s geological history and surface processes (McKay et al. 1991). In the visible and near-infrared (VNIR) region, photometric, polarimetric, and spectroscopic measurements provide important information about the properties of the surface material (Shkuratov et al. 2011; Hapke 2012). The spectral reflectance primarily reveals chemical and mineralogical compositions, while the directional reflectance and polarimetric data are more indicative of physical properties including particle size distribution, packing density, transparency, and surface roughness of the regolith layers. For example, the lunar opposition effect, or the brightness enhancement at small phase angles, is highly sensitive to regolith porosity. The lunar linear polarization curves, showing minima Pmin and maxima Pmax at small and large phase angles respectively, are closely related to particle size distribution and surface textures (Shkuratov et al. 2011; Hapke 2012).
Laboratory measurements of lunar regolith from Apollo and Luna missions have revealed that (1) fine-grained samples show polarization properties very similar to their sampling sites, while coarse lunar rocks and breccia exhibit distinct polarization features (Geake et al. 1970); (2) the maximum linear polarization Pmax and the slope h of the polarization phase curve around the inversion angle αinv (where polarization changes from negative to positive) are inversely proportional to the albedo A (Dollfus et al. 1971; Bowell et al. 1972; Dollfus & Geake 1977); and (3) the increase in circular polarization as phase angle decreases at small phase angles demonstrates the importance of coherent-backscattering effects on the lunar opposition effect (Hapke et al. 1993). The first two relationships have proven particularly useful for estimating surface packing states, albedo, and/or grain sizes (Shkuratov et al. 2011; Belskaya et al. 2015).
One long-standing question is whether laboratory measurements of returned lunar samples can reliably be used to interpret remotely sensed data, whether telescopic, on-orbit, or in situ.
On 16 December 2020, the Chang’e-5 (CE5) mission returned 1731 g of lunar regolith and rocks collected from the northern Oceanus Procellarum on the northwest lunar near-side. This provides an unprecedented opportunity for detailed laboratory studies to complement the in situ measurements and remote sensing observations. To date, two research groups have studied the photometric properties of the CE5 landing site in the phase angle range 17°-92° using in situ measurements from the Lunar Mineralogical Spectrometer (LMS) on board the CE5 lander, concluding that the regolith grains are forward-scattering, irregularly shaped, with a low density of internal scatterers (Xu et al. 2022; Guo et al. 2024). In contrast, laboratory photometric measurements of the returned CE5 regolith in the phase angle range 41°-101° revealed backward-scattering features (Chang et al. 2023).
The accurate determination of the regolith scattering properties from photometric data requires observations spanning phase angles of at least 20°-120° (Hapke 2012). However, neither in situ nor laboratory measurements of CE5 regolith have covered this full range. Polarimetric characterization of the returned samples provides essential baseline data for interpreting current (Kim et al. 2023) and future lunar polarimetric measurements. Therefore, a comprehensive polarimetric analysis of the CE5 regolith is necessary. To address these questions, we conducted detailed laboratory photometric, polarimetric, and spectroscopic measurements of CE5 samples and compared them with in situ and remote sensing data.
2 Methods
2.1 Sample descriptions and preparations
The sample measured for this work was the surface-scooped regolith ID CE5C0600 that had a particle size distribution of 4-300 μm (Cao et al. 2022). To make a smooth surface for measurement, we first slowly poured the powder into the sample holder using a spoon, then smoothed the surface with a straight knife. We did not shake the sample to settle it down as the regolith on the Moon should be more porous. After cleaning up the grains scattered on the sample holder edge, we covered the sample holder with a circular-ring-shaped black velvet to reduce the stray light incident onto the sample holder. The sample holder for the three-color goniometer had an inner diameter of 20 mm and a depth of 3 mm. The optical thickness of the layer was estimated as τ = NσEZ, where N is the number of particles per unit volume, σE the extinction cross section and z the regolith layer’s geometric thickness. The estimation gave a typical value larger than 100, and thus the sample thickness can be regarded as infinite. The sample holder for spectroscopic measurement had an inner diameter of 9.5 mm and a depth of ~2.2 mm. Figure 1 shows photographs of the sample in nadir view and under illumination by a 633 nm He-Ne laser at an incidence zenith angle of 60°.
To estimate the porosity of the sample during the measurement, we first weighed the sample’s total mass as m = 1.02 g. With a sample holder volume V = 0.94 cm3 and the bulk density of the lunar soil as ρt = 3.195 g/cm3 (Li et al. 2022), the filling factor and porosity can be estimated as
 (1)
(1)
 (2)
(2)
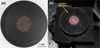 |
Fig. 1 Photos of the CE5 regolith layer surface. (a) Top view; (b) Illuminated by a 633 nm He-Ne laser at 60° incident zenith angle. |
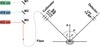 |
Fig. 2 Schematic of the optical path and measurement geometry of the three-color goniometer. M1, M2, and M3 are mirrors that direct the laser beams into the optical fiber. The angles i, e, α, and n denote the incident zenith angle, viewing zenith angle, phase angle, and surface normal vector, respectively. LP1 and LP2 are linear polarizers for the incident and viewing beams. λ/2 WP and λ/4 WP indicate the halfwave plate and quarter-wave plate, respectively. |
2.2 Photometric and polarimetric measurements
The photometric and polarization measurements were carried out by a three-color goniometer capable of measuring the bi-directional reflectance in the principal plane, which is the plane containing the incident direction, viewing direction, and the global surface normal at an angular resolution of 1.5°. A detailed description of the system and calibration of this device can be found in Zhang et al. (2022), and only a brief outline is given here. As shown in Fig. 2, the system had three laser light sources: a He-Ne laser operated at 633 nm and two Spectra-Physics DPSS lasers of 532 and 473 nm. After passing through a chopper and being reflected by a mirror, the beam is focused into a multimode fiber and then directed to the incident optics assembly mounted on a manually rotatable bar. A collimator was used to direct the incident light onto the sample surface. The scattered light was collected by a telescope with a silicon photodiode mounted on a rotating bar controlled by a servo motor and gear reducer. To reduce the effects of laser power fluctuations, a monitor detector was set to look at the sample surface and the ratio of the two detectors was used as the reflectance intensity. Measurements were made at normal and 60° incident zenith angles, with phase angle coverage of 3°-70° and 3°-130°, respectively. By using an electric liquid crystal retarder, laser speckle was significantly reduced (Zhang et al. 2022).
Since the laser exiting the fiber had residual linear polarization, to obtain the reflectance under unpolarized radiation, a linear polarizer and a half-wave plate were used to generate the S- and P-polarized light that were perpendicular and parallel to the principal plane. The advantage of using a half-wave plate to rotate the incident polarization is that the incident power can be kept constant. The scattered intensity with unpolarized incident light can then be obtained by averaging the two intensities with s- and p-polarized incidences as
 (3)
(3)
where the subscripts S and P stand for S- and P-polarized incidences and U stands for unpolarized reflectance. We use the reflectance factor (REFF) to represent the photometric properties of the regolith layer. The REFF is defined as the ratio of the reflectance of the surface to that of a perfect diffuser under the same illumination and viewing conditions:
 (4)
(4)
Here μ0 is cos(i) and I and J are the reflected radiance and the incident irradiance, respectively. In practice, we used the relative calibration to obtain the REFF, i.e., by ratioing the intensity from the sample and that from a 99 % Spectralon, and performed a REFF correction to get the absolute REFF (Zhang et al. 2022). The color ratio was obtained by taking the ratio of the REFF at two different wavelengths, λ1 and λ2 as
 (5)
(5)
For linear polarization measurements, we added a linear polarizer in front of the viewing optics assembly and sequentially measured ISP, ISS, IPP, and IPS, where ISP stands for the incident and reflected radiations being S- and P-polarized, and so forth. The degree of linear polarization (DOLP) (Bohren & Huffman 2008) was obtained as
 (6)
(6)
For circular polarization measurements, the configuration shown in Fig. 2 was used to obtain the degree of circular polarization (DOCP). Specifically, the incident laser first passed through a linear polarizer (LP1), then a quarter-wave plate before reaching the sample. The reflected light then passed through another quarter-wave plate, a second linear polarizer (LP2), and finally the detector. With this configuration, both the right and left circularly polarized light can be generated. By denoting the right- and left-handed polarizations by R and L, the DOCP can be obtained as (Hapke et al. 1993; Bohren & Huffman 2008)
 (7)
(7)
where Same and Opposite means the incident and viewing circular polarizations have the same and opposite chirality, respectively. All measurements were performed on rotating samples at a frequency of 1 Hz, and the average of four measurements was used as the final result.
2.3 Fourier transform infrared spectroscopic measurement
In order to measure the reflectance spectra from the visible to mid-infrared, a Bruker Vertex 70 Fourier transform infrared spectrometer (FTIR) was used. The scattering configuration was approximately 45°-45° bi-conical, with a cone angle of 45°. The spectral resolution was set to 16 cm−1 in the spectral range of 0.5-1.0 μm and 4 cm−1 in the range of 1.0-25 μm.
Since our focus in the FTIR measurements was on spectral rather than photometric features, only relative reflectance was needed. This was obtained by ratioing the sample reflectance to that of a 99 % Spectralon standard in the VNIR region and to a diffuse gold (InfraGold) standard in the mid-infrared. Each sample was measured four times, with the sample holder rotated by 9o° between measurements. The average of the four measurements was used as the final spectrum to reduce the influence of surface inhomogeneities. The reflectance values in the visible (VIS, 0.5-1 μm) and mid-infrared (MIR) (2.5-25 μm) regions were scaled to ensure smooth continuity with the near-infrared (NIR, 1-2.5 μm) reflectance.
2.4 Spectro-goniometric measurements
A custom spectro-goniometer capable of measuring the bidirectional reflectance in the upper hemisphere in the VNIR range of 350-2100 nm was used to measure the sample reflectance. A detailed description of the system including its calibration, characterization, and measurement procedures can be found in (Jiang et al. 2022; Zhang et al. 2022). We measured the sample at two incident zenith angles, i = 30° and 45°, and various viewing zenith angles from e = 0° to 70° with a step of 10° and at various azimuth angles φ=0° to 165° with a step of 15°.
We used all three instruments as mentioned above because they are complementary. For example, the three-color goniometer can measure the reflectance at smaller phase angles with polarization capabilities, the FTIR can cover a broad spectral range, and the spectro-goniometer can measure the reflectance in the upper hemisphere, not only in the principal plane. The complementary information provided by these measurements would help us better understand the connections between the sample information and its macroscopic optical properties.
3 Results
3.1 Bi-directional reflectance
Figure 3 shows the REFF measured in the principal plane by the three-color goniometer at four incident angles (0°, 30°, 45°, and 60° ; Figs. 3a, b) and in the upper hemisphere by the spectro-goniometer at two incident angles (30° and 45° ; Figs. 3c, d), all in 633 nm. Both sets of data show a bowl-like shape with both backward- and forward-scattering lobes. At normal incidence, the lunar regolith is highly non-Lambertian, with the maximum reflectance twice the value of the minimum reflectance (Fig. 3a, b). As the incident zenith angle increases, reflectance becomes more anisotropic, with the maximum REFF nearly three times the minimum REFF at i = 60°. The REFF normalized at the minimum phase angle (~3°) shows that as the incident angle increases, the bowl becomes wider and more symmetrical. These curves have similar shapes among the three wavelengths (i.e., 473, 532, and 633 nm), but their absolute values increase as wavelength increases, indicating the red spectral slope of the CE5 soil (Fig. A.1). The colored plots in Figs. 3c and 3d are the interpolated REFF from the ~100 discrete measurement positions. An opposition surge is observed at small phase angles, followed by a decrease at intermediate phase angles and a subsequent increase at larger phase angles. The data measured by the three-color goniometer agree well with those obtained from the spectro-goniometer (Fig. A.2).
3.2 Color ratios
Figure 4 shows the color ratios of the CE5 soil measured by the three-color goniometer and the spectro-goniometer. Since the silicone photodiode detector of the three-color goniometer has a lower signal-to-noise ratio (S/N) at shorter wavelengths (473 nm), making the color ratio 633 nm/473 nm noisier than the 633 nm REFF shown in Fig. 3. Nevertheless, the color ratio curves increase at small phase angles and then flatten at larger angles (Fig. 4a). Overall, the phase reddening effect is relatively weak, with a maximum change of about 6 % at the largest phase angles after normalization (Fig. 4b). Trends observed by both instruments are consistent, although the spectro-goniometer data appear smoother, likely due to the higher stability and incoherent nature of its quartz tungsten halogen light source. The colorimetric opposition effect at small phase angles is not visible due to noise.
For measurements in the upper hemisphere by the spectro-goniometer (Figs. 4c,d), the color ratios also increase monotonically with phase angle. The angular variations in the rainbowcolored ratios reach −0.05, significantly above the noise level, suggesting that these patterns likely reflect real sample characteristics rather than artifacts, though the underlying physical mechanisms remain unclear. Qualitatively, both datasets exhibit reddening but not bluing (Fig. A.2).
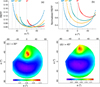 |
Fig. 3 REFF measured by the three-color goniometer (a)(b) and the spectro-goniometer (c)(d), all in 633 nm. (a) Measurement made within the principal plane at four incident zenith angles: 0°, 30°, 45°, 60°; (b) REFF normalized at the smallest phase angle (~3°); (c) REFF measured by the spectro-goniometer in the upper hemisphere at i = 30° and (d) i = 45°. The image data shown in (c) and (d) were interpolated from ~100 discrete measurement points. In each image plot, the radial distance from the center represents the zenith angle, and the azimuth angle measured from due north represents the relative azimuth angle. The incident zenith directions are indicated by orange dots. The backward and forward scattering directions are along the azimuth angles of 0° and 180°, respectively. |
3.3 Polarizations
Although the three-color goniometer had a 473 nm light source, the absence of commercially available linear polarizers and waveplates at this wavelength, combined with the low S/N of the silicon-photodiode detector in the blue, rendered the 473 nm polarization measurement unreliable. Therefore, we only measured the polarization phase curves at 532 and 633 nm. Figure 5 shows the DOLP and DOCP curves at four incident zenith angles: i = 0°, 30°, 45°, and 60°. Since the curves are very similar across different incident zenith angles, all measurements are plotted together in a single graph.
The DOLP curve at 633 nm (Fig. 5a) has a higher S/N than that at 532 nm. For the curve at 633 nm, the CE5 soil shows negative polarization at small phase angles, with a minimum polarization (Pmin) of approximately −0.1 to −0.2% and an inversion angle (αinv) of approximately 20°-25°. The positive polarization branch has a maximum polarization (Pmax) of about 16% at an incident angle i of 60° and a peak angle (αmax) of approximately 100°-110°. For the curve at 532 nm, noise makes it difficult to determine the presence of negative polarization at small phase angles. However, we can still observe that the curve exhibits stronger positive polarization (approximately 21%) than that at 633 nm at larger phase angles.
The DOCP curve at 633 nm (Fig. 5b) also has a higher S/N compared to that at 532 nm. As the phase angle increases, the DOCP curves for both colors initially decrease slightly between 0° and 10°, then increase in the mid-phase angle region, and finally rise sharply at very large phase angles. The DOCP curves at 633 and 532 nm exhibit similar shapes, with the 532 nm curve positioned lower at small and medium phase angles.
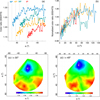 |
Fig. 4 Color ratios of the CE5 soil measured by the three-color goniometer (a)(b) and by the spectro-goniometer (c)(d). The color ratios between 633 and 473 nm with (a) absolute value and (b) normalized at the smallest phase angle (~3°). The color ratios between 500 and 800 nm with (c) i = 30° and (d) i = 45°. In each image plot, the radial distance from the center represents the zenith angle, and the azimuth angle measured from due north represents the relative azimuth angle. The incident zenith directions are indicated by orange dots. The backward and forward scattering directions are along the azimuth angles of 0° and 180° , respectively. |
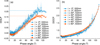 |
Fig. 5 Polarization curves of the CE5 soil vs phase angles measured by the three-color goniometer at four incident angles. (a) DOLP with Pmax ~ 16% at 633 nm and ~21% at 532 nm; (b) DOCP curves at 633 nm and 532 nm. The shaded regions indicate measurement uncertainties. |
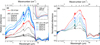 |
Fig. 6 VNIR and MIR relative reflectance spectra of the CE5 sample and comparison with those of laser-irradiated JSC-1A lunar regolith simulant (LRS). (a) Relative reflectance spectra; (b) Reflectance spectra normalized to 1 at 0.7 μm. The inset in (a) highlights the position of the Christiansen feature. |
3.4 Reflectance spectra
Figure 6 shows the VNIR and MIR relative reflectance spectra of the CE5 sample, compared with those of laser-irradiated JSC-1A lunar regolith simulant (LRS) (Jiang et al. 2019). All spectra were acquired using the FTIR spectrometer. The original JSC-1A LRS had a particle size distribution of 0 mm to 1 mm and was ground and wet-sieved to obtain a finer fracton of 0 μm to 45 μm. Both the original (<1 mm) and sieved (<45 μm) samples were irradiated with a pulsed laser at energies of 50 mJ for two, four, and six shots, denoted as *2, *4, and *6, respectively. We evenly spread 0.9 g of the powdered sample onto a 50 mm × 50 mm sample holder and irradiated it in a zig-zag pattern to ensure complete surface coverage. The pulsed laser had a spot size of 0.5 mm, with each pulse lasting 6-8 ns at a frequency of 15 Hz. During irradiation, the sample holder was moved at a speed of 1 mm/s (Jiang et al. 2019).
Compared with the original JSC-1A LRS with a broad size distribution, the sieved finer grains exhibit higher relative reflectance (Fig. 6a), but display a slightly redder spectral slope in the VNIR region (Fig. 6b). After pulsed-laser irradiation, the <1 mm samples became progressively darker, spectrally flatter (indicating a bluing trend), and showed weakened absorption features. In contrast, the <45 μm samples exhibit the opposite behavior, with increasing spectral reddening. This trend aligns with the general observation that rock or mineral powders tend to show redder spectral slopes as particle size decreases, as seen in the two original JSC-1A LRS samples (Fig. 6b).
The inset in Fig. 6a shows that the CE5 sample exhibits a Christiansen feature at 8.65 μm (~1156 cm−1 ), slightly longer in wavelength than that of the JSC-1A LRS. In the 1 μm to 4 μm region, the CE5 sample displays relative reflectance values comparable to those of the original JSC-1A LRS (<1 mm), but with more subdued absorption features and the reddest spectral slope (Fig. 6b). The CE5 sample CE5C0600 consists of particles ranging from approximately 4 and 300 μm, with most mineral grains between 3 and 40 μm (Cao et al. 2022), closely resembling the sieved JSC-1A LRS fraction (<45 μm).
The average glass content of the CE5 soils is 16.6 wt%, substantially lower than that of the Apollo soils (Li et al. 2022), suggesting that the CE5 samples experienced fewer micro- or macrometeoroid impacts. In combination with the predominance of fine regolith particles, these characteristics imply that the regolith at the CE5 landing site was subjected to prolonged but low-intensity space weathering. However, it remains uncertain whether the CE5 spectral characteristics have reached the saturation level typically associated with mature space weathering.
Both particle size distribution analysis (Li et al. 2022) and visible-infrared spectral properties (Lu et al. 2023) suggest that the CE5 soils are mature, with solar wind irradiation identified as the dominant alteration process at the landing site (Guo et al. 2022). However, magnetic measurements (Qian et al. 2024) and iron isotopic analyses (Li et al. 2025) indicate low maturity. This apparent discrepancy may arise from the differing sensitivities of analytical techniques to various stages of space weathering, with optical methods being more responsive to early-phase alterations, while magnetic and isotopic indicators may reflect longer-term cumulative effects.
4 Discussion
4.1 REFF
Laboratory-measured REFFs generally exhibit a pronounced forward-scattering lobe at large phase angles, especially at large incident zenith angles, a behavior often observed in simulant materials (Shkuratov et al. 2006; Pommerol et al. 2013; Johnson et al. 2013; Schröder et al. 2014; Jost et al. 2017), meteorites (Beck et al. 2012), and returned samples (Johnson et al. 2013; Foote et al. 2020). This forward lobe has been seen in in situ measurements on the Martian surface (Johnson et al. 2006, 2015, 2021), but was not seen in in situ lunar measurements by the Chang’e-3 and Chang’e-4 rovers (Jin et al. 2015; Jiang et al. 2021).
There are two possible factors that may account for the discrepancy between laboratory and in situ data. The first is that different scattering geometries including the incident zenith angle, viewing zenith, and the relative azimuth angle can make the phase curves different. As shown in Fig. 3b, the REFF curves at large incident angles have a wider and/or deeper bottom and a more enhanced forward-scattering lobe. The second factor is that different physical properties (e.g., porosity and particle size) and/or composition may also play a role.
To compare the REFF curves measured at different incident and viewing zenith angles, we converted REFF to reduced reflectance (rR) using
 (8)
(8)
where r is bidirectional reflectance and μ0/(μ0 + μ) the Lommel-Seeliger disk function with μ the cosine of the viewing zenith angle. Figure 7 compares the reduced reflectance normalized to 1 at the smallest phase angle (~3°) of the different samples. As the incident zenith angle increases, the REFF of the CE5 soil exhibits a larger maximum-minimum contrast (Fig. 3b). When converted to reduced reflectance, however, such differences are greatly suppressed (Fig. 7). Since the in situ REFF curve of the CE5 landing site did not cover the small phase angle ranges, it is not included here, and those of the CE3 and CE4 are used in the comparisons. Although the CE5 regolith exhibits one of the strongest opposition effects among the samples measured in our laboratory, with approximately a twofold increase in rR, it remains significantly weaker than the in situ measurements from the CE3 and CE4 rovers, which show an approximately eightfold increase in rR.
We also downloaded the photometric phase curves of the Apollo samples measured by the Bloomsburg University Goniometer (BUG) (Shepard 2001; Foote et al. 2020) from the Planetary Data System1. The selected samples (IDs 10084, 12001, 15071, 61141, 68810, and 7 0181) were plotted in the principal plane at various incident zenith angles (i = 0°, 15°, 30°, 45°, and 60°) and at two wavelengths (550 and 750nm). These data are used here as a reference background (shown in gray). The CE5 curve appears relatively neutral at small phase angles, but exhibits a more pronounced forward-scattering lobe. The contrast between the maxima and minima is comparable in magnitude to that of the Apollo samples.
Ohtake et al. (2013) and Foote et al. (2020) observed that the laboratory-measured reflectance of Apollo 16 samples is higher than the reflectance measured at the Apollo 16 landing site by orbiters. They attributed this discrepancy partly to an increased filling factor in the laboratory samples and partly to potential differences in composition and surface maturity. For instance, a more compact surface or larger grain sizes can enhance specular reflectance components (Schröder et al. 2014), thereby strengthening the forward-scattering lobe and suppressing the backward-scattering lobe.
We previously measured the REFF of the JSC-1A lunar regolith simulant (LRS) before and after the pulsed-laser irradiation (Jiang et al. 2019). We found that the sample with grain sizes smaller than 1 mm exhibited a decrease in the forwardscattering lobe with increasing irradiation level, whereas the sample with grain sizes below 45 μm showed little to no change.
Based on scanning electron microscope (SEM) image analysis, this behavior was attributed to increased surface roughness on larger grains. These results suggest that space weathering processes, which induce both darkening and surface roughening, may also contribute to the suppression of forward scattering at large phase angles.
While space weathering effects likely play a role, the observed weak forward-scattering lobe and pronounced opposition effect in the in situ phase curves are likely dominated by the high porosity of the surface regolith, with space weathering acting as a secondary factor. The lunar regolith’s significant porosity increases scattering at small phase angles, and this effect is particularly pronounced in the natural lunar environment. Upon the sample’s return to Earth, however, the regolith’s porosity decreased due to Earth’s stronger gravity and the sample preparation procedures, which led to an increased forward-scattering lobe in laboratory measurements. Additionally, at very large incident zenith angles (e.g., −80° for Chang’e-4), corresponding to early morning and late afternoon observations that avoided the high surface temperatures of midday, the forward-scattering lobe may become extremely narrow, making it difficult to detect with the onboard cameras. This hypothesis warrants further investigation through controlled laboratory experiments, particularly those focused on the effects of porosity and their interplay with space weathering.
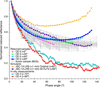 |
Fig. 7 Reduced reflectance curves of the CE5 soil measured at different incident angles and compared with previous measurements on JSC-1A LRS Jiang et al. (2019), in situ extracted curve from the CE3 (Jin et al. 2015) and CE4 (Jiang et al. 2021) missions, and laboratory-measured Apollo samples by the Bloomsburg University Goniometer (Shepard 2001; Foote et al. 2020). All curves are normalized at −3° phase angle. |
4.2 Linear and circular polarization phase curves
Due to the low S/N of the linear polarization measurements at small phase angles, accurately determining Pmin, αinv, and h (the slope of the DOLP curve at the inversion angle αinv) is challenging. Therefore, we focus here solely on the parameters of the positive polarization branch, specifically the maximum polarization Pmax. The inverse correlation between the maximum Pmax and the albedo A can be described on a log-log scale as
 (9)
(9)
where a and b are empirical constants that depend on the dataset and the wavelength (Dollfus et al. 1971; Bowell et al. 1972; Geake & Dollfus 1986; Shkuratov & Opanasenko 1992; Dollfus 1998). In Fig. 8, we used the laboratory data in 580.0 nm from (Geake & Dollfus 1986), selected for their comprehensive dataset coverage, along with the Moon’s V-band (558.6 nm) observational data from Jeong et al. (2015) as references. The A values are defined as the reflectance relative to a smoked MgO screen at a phase angle of α = 5° in a mirror configuration (Geake & Dollfus 1986), and as the albedo calibrated to α = 6° in Jeong et al. (2015). For CE5, we used the REFF value at an incident angle i = 0° and phase angle α = 5° as A, which is ~0.0836 at 532 nm and ~0.0917 at 633 nm.
The CE5 data points deviate from the simplified form of the Umov relation, where the constant a is assumed to be unity (Dollfus 1998; Shkuratov et al. 2011). The empirical line defined by Eq. (9) can shift depending on the value of b, which may be influenced by grain size. The lunar fines measured by Geake & Dollfus (1986) predominantly have grain sizes around 10 μm, while the CE5 data points fall near the line corresponding to terrestrial rock powders with grain sizes smaller than 50 μm. The ground observation of the CE5 landing site (Jeong et al. 2015) lies in the low-albedo-high-polarization portion of the main region (gray area in Fig. 8). In contrast, the CE5 regolith measured in this work exhibits similar albedo but higher polarization values, placing them outside the main region. Since increased sample compaction tends to increase polarization at large phase angles (Geake & Dollfus 1986), this shift may also reflect the higher degree of compaction discussed in the previous section.
As mentioned above, Hapke et al. (1993) measured eight Apollo soils and found that all exhibited a decrease in the linear polarization ratio and an increase in the circular polarization ratio as the phase angle approached zero. This behavior was attributed to the effect of coherent backscattering. Subsequent measurements on planetary analogs (Hapke et al. 1998; Nelson et al. 1998, 2000; Piatek et al. 2004; Nelson et al. 2018) confirmed that this phenomenon occurs in a wide range of particulate layers composed of touching particles that are larger than the wavelength of the incident radiation. Figure 9 presents a comparison of the DOCP curves at 633 nm with those of the Apollo samples at small phase angles (Hapke et al. 1993). The CE5 soil exhibits a very similar curve shape, with absolute values comparable to those of samples 10084, 75121, and 79221. Figure 9b shows the average DOCP values between phase angles 0° and 18° plotted against the normal albedo for the Apollo samples (from Hapke et al. 1993), along with the REFF value at i = 0°, α = 5° for the CE5 sample measured in this study. When the average DOCP values of the Apollo samples are fitted with a power-law function, they appear to saturate at high normal albedo regions. At 442 nm, the average DOCP values are approximately 10% higher than those at 633 nm, whereas the values for the CE5 soil at 532 nm are slightly lower, by about 13%. The reason for this discrepancy remains unknown.
Measurements of circular polarization phase curves for planetary analogs are rare, especially at large phase angles. Piatek et al. (2004) demonstrated that hematite grains with three different size distributions exhibit a broad coherent-backscattering opposition effect, as indicated by an increase in circular polarization beginning at phase angles below 40° and continuing to rise at larger angles. However, it remains unclear whether a similar behavior occurs in other materials. Since the degree of circular polarization (DOCP) can be expressed in terms of Mueller matrix elements (e.g., Shkuratov et al. 2012),
 (10)
(10)
where M 11(α) and M44(α) are elements of the Mueller matrix (Bohren & Huffman 2008; Mishchenko et al. 2009). We can obtain the ratio of the Mueller matrix elements as
 (11)
(11)
Since the Mueller matrix formalism describes scattering by both individual particles and densely packed particulate media, the DOCP for a sample in a single-scattering configuration (e.g., aerosol suspension) can be determined if the M11 and M44 elements are measured. At a wavelength of 647 nm, these two elements have been experimentally determined by Escobar-Cerezo et al. (2018), enabling the calculation of the corresponding DOCP, which is shown in Fig. 9c. To allow for broader comparisons, the ratio M44/M11 is also plotted for several reference materials, including the Allende meteorite, terrestrial basalt, calcite, olivine, and palagonite, using data from Muñoz et al. (2011, 2012) in Fig. 9d. A comparison between the DOCP of the packed CE5 regolith and that of JSC-1A LRS under single-scattering conditions reveals similar curve shapes, although the CE5 regolith exhibits lower DOCP values and a gentler slope. Notably, the JSC-1A curve falls within the typical range for terrestrial samples, despite the variation in their individual polarization signatures
Using Eq. (11) yields the M44/M11 values for the CE5 sample at 633 nm and 532 nm that are shown in Fig. 9d. The resulting curves for the CE5 regolith lie below those from the single-scattering measurements, suggesting that multiple scattering within the densely packed sample may have reduced the observed DOCP values.
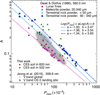 |
Fig. 8 Comparison of the albedo A vs. Pmax for the CE5 sample at 633 and 532 nm (this work), ground-based observation at 558.6 nm (Jeong et al. 2015), and laboratory measurements on the Apollo and Luna samples at 580 nm (Geake & Dollfus 1986). The parameters for the empirical lines are from Geake & Dollfus (1986). |
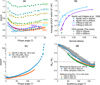 |
Fig. 9 Comparisons of the DOCP measurements in 633 nm for the CE5 regolith with those of the Apollo samples at small phase angles measured by Hapke et al. (1993), and with the JSC-1A LRS (Escobar-Cerezo et al. 2018) measured in a single-scattering configuration (Muñoz et al. 2012), are shown as follows: (a) DOCP curves of the Apollo samples and the CE5 regolith; (b) averaged DOCP values between 0° and 18° phase angle vs normal albedo at different wavelengths; (c) DOCP curves of CE5 regolith compared with those of JSC-1A LRS measured in the single-scattering configuration; (d) the M44/M11 element for JSC-1A LRS and other samples (e.g., olivine, forsterite, palagonite, allende, basalt, calcite) measured in single-scattering configuration by Muñoz et al. (2012), along with the corresponding values for CE5 retrieved from Eq. (11). |
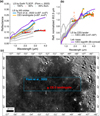 |
Fig. 10 VNIR reflectance spectrum of the CE5 sample and comparison with those of the in situ measurements by the spectrometer (LMS) on board the CE5 lander, the ground-based telescope (TLSCP) observation (Flom et al. 2022), and the orbital data from M3 (Pieters et al. 2009) for the landing site (LS) (6 × 6 pixels), the region sampled in Flom et al. (2022). (a) Reflectance values; (b) Reflectance normalized to 1 at 2.3 μm; (c) Map showing the CE5 landing site and the region approximately where Flom et al. (2022) sampled the spectra. The base map is from the Lunar Reconnaissance Orbiter Camera (Robinson et al. 2010; Wagner et al. 2015). |
4.3 Comparison with in situ, orbital, and ground-based observed spectra
Figure 10 compares the reflectance spectra of the CE5 soil and landing site as measured in the laboratory, in situ, from orbit, and by ground-based telescope. For the laboratory data, we used the FTIR spectrum shown in Section 3.3 because of its higher S/N. However, the FTIR measurement was acquired in a bi-conical geometry with incidence angle i ~ 45°, viewing angle e ~ 45°, and phase angle α ~ 90°. To estimate how this geometry compares to our REFF measurements, we compared the REFF values at 633 nm obtained at two geometries. The value measured in this work at i = 30°, e = 0°, and α = 30° is approximately 0.668, which is close to the value measured at i = 45°, e = 45°, and α = 90° (approximately 0.660). In contrast, the FTIR relative reflectance at this wavelength is approximately 0.770. Therefore, we scaled the FTIR spectrum by a constant factor (0.660/0.770) to approximate its REFF spectrum for comparison.
The LMS on board the CE5 lander acquired a total of 11 visible and near-infrared spectra, covering the wavelength range from 0.48 to 3.2 μm. Because the thermal emission from the lunar surface begins to contribute significantly to the measured signal beyond 2 μm (Li & Milliken 2016), we applied the thermal correction method proposed by Shkuratov et al. (2011) to the in situ spectra. This allowed us to obtain reflectance spectra with minimal thermal contamination. The detailed steps of this correction procedure are provided in Appendix B. Of the 11 in situ spectra, we present only 6 in this work, as the remaining measurements either have low S/N values or were taken from targets that are not representative of lunar soil. In Fig. 10 the in situ spectra are shown in gray as a reference.
The ground-based observation is taken from Flom et al. (2022), which focuses on the hydration absorption band near 3 μm. We also collected orbital spectra of the CE5 landing site and its surrounding area, as measured by the Moon Mineralogy Mapper (M3) (Pieters et al. 2009). A 6 × 6 pixel region, with a spatial resolution of 140m/pixel×280m/pixel was selected around the CE5 landing site (Fig. 10c). The larger landing area encompasses approximately 300 000 pixels, comparable in spatial extent to that covered by the ground-based observation in Flom et al. (2022). The M3 spectra from both the landing site and the broader area were averaged, and the M3 reflectance data (I/F, Level 2B) were then converted to REFF.
The laboratory spectrum is overall brighter than the in situ and ground-based spectra, while the orbital data from M3 closely resemble the brighter in situ spectra. After normalizing all spectra to unity at 2.3 μm, the FTIR spectrum shows excellent agreement with the orbital data in spectral slope, and both appear slightly redder than the in situ spectra. Minor discrepancies around 1 μm may reflect compositional differences. The groundbased observation yields reflectance values comparable to the in situ measurements in absolute values (Fig. 10a), but with a lower red slope (Fig. 10b). In contrast, the FTIR spectrum appears brighter, likely due to increased packing density after the sample was returned to Earth. When normalized, the FTIR and in situ spectra show good agreement in spectral slope, whereas the ground-based spectra remain slightly flatter (Fig. 10b).
Previous studies on the Apollo 16 samples also reported that the laboratory spectra are consistently brighter than orbital or ground-based observations (Saiki et al. 2008; Ohtake et al. 2010, 2013; Foote et al. 2020). This discrepancy was first attributed to non-representative sample selection and sample compaction, but later work showed that even representative samples exhibit systematic brightening in laboratory conditions (Pieters et al. 2013). A similar trend was noted by Wu et al. (2024), who compared a CE5 subsample (CE5C0600) with M3 orbital data; they find a higher reflectance and a deeper 1 μm Band I absorption in the laboratory spectra.
While the sampling process may have collected less mature subsurface material, it is unlikely that sampling, transport, or preparation altered the composition, grain surface texture, or size distribution. More plausibly, the processes reduced macroscopic roughness and porosity, especially under Earth’s gravity. Ohtake et al. (2010) showed that Apollo 16 soil reflectance varies with bulk density, and Hapke modeling suggested in situ porosities of 74-87%, later revised to 83 ± 3% (Hapke & Sato 2016). By comparison, our CE5 sample shows a laboratory porosity of only 66 %, lower than typical lunar values.
In addition to porosity, space weathering may also influence reflectance features. Studies at the Chang’E-3 site (Clegg-Watkins et al. 2016; Wang et al. 2017) showed that disturbances such as rocket exhaust preferentially affected the finest, most weathered surface fraction, indicating that the uppermost regolith is more mature than material immediately below. These findings suggest that the observed spectral changes in the CE5 samples may result from both porosity and regolith configuration during transport. Because each landing site has unique geological characteristics, simply fitting laboratory spectra to photometric models for in situ extrapolation is not recommended. A systematic laboratory investigation of the returned lunar samples that span the controlled porosities, especially at high values, and are characterized by their degree of space weathering, combined with photometric, polarimetric, and spectroscopic measurements under consistent geometric conditions, is essential for reliably linking returned samples to in situ optical properties.
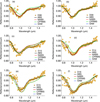 |
Fig. 11 Continuum-removed Chang’e-5 lander spectrum (blue dots) compared with the best-matching LUT synthetic spectra, determined using four different fitting metrics: ABS, NABS, CPRMS, and SAM. |
4.4 Retrieving relative mineral abundances using spectroscopic look-up tables
To estimate the mineral abundances from the six in situ spectra shown in Figure 10, we applied a synthetic lunar spectral mineral lookup table (LUT) method based on radiative transfer models (Lucey 2004; Lucey et al. 2014). This approach enables us to retrieve the relative abundances of four major lunar minerals: olivine (OLV), orthopyroxene (OPX), clinopyroxene (CPX), and plagioclase (PLG). To eliminate thermal emission effects, the analysis was restricted to the spectral range of 750-1550 nm (Lucey 2004; Lucey et al. 2014).
After continuum removal, we identified the best-matching synthetic spectrum from the LUT by employing four similarity metrics: absolute difference (ABS), normalized absolute difference (NABS), centered pattern root mean square (CPRMS), and spectral angle mapper (SAM). The procedures for continuum removal and spectral matching follow those used in previous analyses of in situ spectra from the Chang’e-3 and Chang’e-4 missions (Zhang et al. 2015; Hu et al. 2019; Ma et al. 2020).
The best-matching LUT spectra for the six in situ measurements are shown in Fig. 11, and the corresponding relative mineral abundances are summarized in Table 1. These results indicate that the CE5 landing site is dominated by PLG (49.92wt%), followed by CPX (25.21 wt%). OPX (10.15wt%) and OLV (14.71 wt%) are present in similar proportions.
The same LUT-based method was also applied to infer mineral abundances from the FTIR spectrum shown in Figure 10. Table 2 also lists the mean mineral abundances within a ~1200 m by ~ 1200 m region around the CE5 landing site, derived from the global lunar mineral maps produced using Kaguya’s Multiband Imager (MI) data (Lemelin et al. 2015, 2016, 2019), as well as the mineral abundances of the CE5 samples previously reported (Cao et al. 2022; Li et al. 2022). The CE5 regolith sample used in this work is the same as that analyzed by Cao et al. (2022), who employed Raman spectroscopy to determine mineral abundances. Their measurement results are in agreement with our retrievals using the FTIR spectrum.
When comparing mineral abundances, the results of Cao et al. (2022) and Li et al. (2022) should be considered as reference values. The unmixing results of the CE5 in situ spectrum should be compared with those of Li et al. (2022) as their data represent the average composition of the CE5 return sample. Our analysis shows that the olivine abundances derived from the LUT-based method in this work and from the spectral unmixing method of Lin et al. (2022) are both significantly higher, more than double the true value reported by Li et al. (2022), while the pyroxene abundances are lower. Our feldspar abundance estimate is also higher than the true value, whereas Lin et al. (2022) report a lower value. When comparing mineral abundances from the unmixing of FTIR spectra of the CE5 sample in this study with Raman measurements by Cao et al. (2022), we observe good agreement for olivine and orthopyroxene (OPX) abundances. However, there is a 10 wt.% discrepancy in the abundances of clinopyroxene (CPX) and feldspar. Since exotic material constitutes only about 5-7% of the CE5 sample (Cao et al. 2022), we conclude that the mineral abundances around the CE5 landing site likely reflect the endmember composition of local mare basalts. Nevertheless, the olivine abundance from the MI data is about twice as high as the true value, while the pyroxene abundance is underestimated. Future studies are needed to address these discrepancies between remote sensing retrievals and laboratory measurements of mineral abundances.
Relative mineral abundances (wt.%) retrieved using CE5 LMS data.
Comparisons of relative mineral abundances of the CE5 samples and landing site retrieved from different sources.
5 Conclusions
We measured the photometric, polarimetric, and spectroscopic properties of the CE5 surface-scooped sample CE5C0600 and compared the results with those from the Apollo and Luna returned samples, in situ measurements, and orbital remote sensing data. The main conclusions are as follows:
The CE5 regolith exhibited a strong opposition effect at small phase angles and a pronounced forward-scattering lobe at large phase angles. The reflectance contrast between the minimum and maximum phase angles is comparable to that of Apollo samples measured in the laboratory, but significantly lower than the reflectance observed in situ. The color ratio curves displayed a monotonic increase with phase angle, indicative of typical phase reddening behavior.
The linear polarization phase curve of the CE5 sample followed the typical lunar pattern, showing a minimum at small phase angles and a maximum (Pmax) at larger phase angles. The Pmax value was slightly higher than those measured from ground-based observations and from the Apollo and Luna samples in laboratory conditions.
The CE5 sample also displayed a typical circular polarization ratio (CPR) curve at small phase angles, with increasing CPR values toward lower phase angles, consistent with those of Apollo samples 10084, 75121, and 79221. However, unlike the Apollo samples, the CE5 sample showed an opposite trend in wavelength dependence. At large phase angles, the CE5 sample exhibited a steep CPR increase, resembling that of the single-scattering matrix for the JSC-1A lunar regolith simulant, but this was likely moderated by multiple scattering effects.
Compared to in situ, ground-based, and orbital measurements, the spectra measured in this study were generally brighter, consistent with previous results for the CE5 and the Apollo samples. After normalization, the CE5 spectra closely matched the orbital data and were only slightly redder than the in situ spectra. However, despite the spectral similarity, the photometric properties differed significantly from in situ and orbital observations.
The relative mineral abundances inferred from the FTIR spectrum and orbital data using the look-up table method are generally consistent with those derived from Raman spectroscopy. However, the olivine abundance obtained in this study and from the Raman spectra is significantly lower than that retrieved through the spectral unmixing of the in situ lander data.
The enhanced forward-scattering lobe, higher Pmax, and overall brighter reflectance spectrum of the CE5 sample may be attributed to increased compaction during the sample handling and return to Earth, and to space weathering effects. A systematic laboratory investigation of the returned lunar samples, encompassing controlled variations in porosity and well-characterized degrees of space weathering, should be coupled with measurements from upcoming robotic missions that will probe the same properties in situ. Such coordinated studies will provide the critical link between laboratory analyses and surface measurements, enabling a more comprehensive understanding of the outstanding questions regarding the optical and physical properties of the lunar regolith.
Acknowledgements
We thank Myriam Lemelin for constructive reviews that improved the quality of the manuscript. We also thank the Chang’e payload team for mission operations and China National Space Administration for providing the Lunar sample (CE5C0600) that made this study possible. This work was supported by the National Natural Science Foundation of China (12373067, 12073024) and Macau University of Science and Technology (SKL-LPS(MUST)-2021-2023).
References
- Beck, P., Pommerol, A., Thomas, N., et al. 2012, Icarus, 218, 364 [CrossRef] [Google Scholar]
- Belskaya, I., Cellino, A., Gil-Hutton, R., et al. 2015, Asteroid polarimetry. In Asteroids IV, eds. P. Michel et al. (Tucson: Univ. of Arizona), 151 [Google Scholar]
- Bohren, C. F., & Huffman, D. R. 2008, Absorption and Scattering of Light by Small Particles (Hoboken: John Wiley & Sons) [Google Scholar]
- Bowell, E., Dollfus, A., & Geake, J. 1972, Proc. Lunar Sci. Conf., 3, 3103 [Google Scholar]
- Cao, H., Wang, C., Chen, J., et al. 2022, Geophys. Res. Lett., 49, e2022GL099282 [Google Scholar]
- Chang, R., Lin, H., Yang, W., et al. 2023, A&A, 674, A68 [NASA ADS] [CrossRef] [EDP Sciences] [Google Scholar]
- Clegg-Watkins, R. N., Jolliff, B. L., Boyd, A., et al. 2016, Icarus, 273, 84 [NASA ADS] [CrossRef] [Google Scholar]
- Dollfus, A. 1998, Icarus, 136, 69 [Google Scholar]
- Dollfus, A., & Geake, J. 1977, Philos. Transact. A Math. Phys. Eng. Sci., 285, 397 [Google Scholar]
- Dollfus, A., Geake, J., & Titulaer, C. 1971, Proc. Lunar Sci. Conf., 2, 2285 [Google Scholar]
- Escobar-Cerezo, J., Muñoz, O., Moreno, F., et al. 2018, ApJS, 235, 19 [NASA ADS] [CrossRef] [Google Scholar]
- Flom, A. J., Lucey, P., Honniball, C., Ferrari-Wong, C., & Head, J. W. 2022, Planet. Sci. Conf., Vol. 2678, 2855 [Google Scholar]
- Foote, E. J., Paige, D. A., Shepard, M. K., Johnson, J. R., & Biggar, S. 2020, Icarus, 336, 113456 [Google Scholar]
- Geake, J., & Dollfus, A. 1986, MNRAS, 218, 75 [NASA ADS] [CrossRef] [Google Scholar]
- Geake, J., Dollfus, A., Garlick, G., et al. 1970, GCA Suppl., 1, 2127 [Google Scholar]
- Gueymard, C. A. 2014, Sol. Energy, 101, 74 [Google Scholar]
- Guo, L., Ren, X., Liu, D., et al. 2024, J. Geophys. Res. Planets, 129, e2023JE007847 [Google Scholar]
- Guo, Z., Li, C., Li, Y., et al. 2022, Geophys. Res. Lett., 49, e2021GL097323 [Google Scholar]
- Hapke, B. 2012, Theory of Reflectance and Emittance Spectroscopy (Cambridge: Cambridge University Press) [Google Scholar]
- Hapke, B., & Sato, H. 2016, Icarus, 273, 75 [NASA ADS] [CrossRef] [Google Scholar]
- Hapke, B., Nelson, R., & Smythe, W. 1998, Icarus, 133, 89 [CrossRef] [Google Scholar]
- Hapke, B. W., Nelson, R. M., & Smythe, W. D. 1993, Science, 260, 509 [CrossRef] [Google Scholar]
- Hu, X., Ma, P., Yang, Y., et al. 2019, Geophys. Res. Lett., 46, 9439 [NASA ADS] [CrossRef] [Google Scholar]
- Jeong, M., Kim, S. S., Garrick-Bethell, I., et al. 2015, ApJS, 221, 16 [Google Scholar]
- Jiang, T., Zhang, H., Yang, Y., et al. 2019, Icarus, 331, 127 [CrossRef] [Google Scholar]
- Jiang, T., Hu, X., Zhang, H., et al. 2021, A&A, 646, A2 [NASA ADS] [CrossRef] [EDP Sciences] [Google Scholar]
- Jiang, T., Zhang, H., Yang, Y., et al. 2022, Rev. Sci. Instrm., 93, 1 [Google Scholar]
- Jin, W., Zhang, H., Yuan, Y., et al. 2015, Geophys. Res. Lett., 42, 8312 [NASA ADS] [CrossRef] [Google Scholar]
- Johnson, J. R., Grundy, W. M., Lemmon, M. T., et al. 2006, J. Geophys. Res. Planets, 111, E02814 [Google Scholar]
- Johnson, J. R., Shepard, M. K., Grundy, W. M., Paige, D. A., & Foote, E. J. 2013, Icarus, 223, 383 [NASA ADS] [CrossRef] [Google Scholar]
- Johnson, J. R., Grundy, W. M., Lemmon, M. T., Bell III, J. F., & Deen, R. 2015, Icarus, 248, 25 [Google Scholar]
- Johnson, J. R., Grundy, W. M., Lemmon, M. T., et al. 2021, Icarus, 357, 114261 [NASA ADS] [CrossRef] [Google Scholar]
- Jost, B., Pommerol, A., Poch, O., et al. 2017, P&SS, 145, 14 [Google Scholar]
- Kim, S. S., Choi, Y.-J., Kang, K., et al. 2023, AGU Fall Meeting Abs., 2023, P21A-01 [Google Scholar]
- Lemelin, M., Lucey, P. G., Song, E., & Taylor, G. J. 2015, J. Geophys. Res. Planets, 120, 869 [NASA ADS] [CrossRef] [Google Scholar]
- Lemelin, M., Lucey, P., Gaddis, L., Hare, T., & Ohtake, M. 2016, Annual Lunar Planet. Sci. Conf., 1903, 2994 [Google Scholar]
- Lemelin, M., Lucey, P. G., Miljkovic, K., et al. 2019, P&SS, 165, 230 [Google Scholar]
- Li, S., & Milliken, R. E. 2016, J. Geophys. Res. Planets, 121, 2081 [NASA ADS] [CrossRef] [Google Scholar]
- Li, C., Hu, H., Yang, M.-F., et al. 2022, Natl. Sci. Rev., 9, nwab188 [CrossRef] [Google Scholar]
- Li, Y., Wang, Z., Qian, Y., et al. 2025, Icarus, 426, 116362 [Google Scholar]
- Lin, H., Li, S., Xu, R., et al. 2022, Sci. adv., 8, eabl9174 [Google Scholar]
- Lu, X., Chen, J., Ling, Z., et al. 2023, Nat. Astron., 7, 142 [NASA ADS] [Google Scholar]
- Lucey, P. G. 2004, Geophys. Res. Lett, 31 [Google Scholar]
- Lucey, P. G., Norman, J. A., Crites, S. T., et al. 2014, Am. Mineral, 99, 2251 [Google Scholar]
- Ma, P., Sun, Y., Zhu, M.-H., et al. 2020, Icarus, 350, 113901 [Google Scholar]
- McKay, D. S., Heiken, G., Basu, A., et al. 1991, The Lunar Sourcebook, 567, 285 [Google Scholar]
- Mishchenko, M. I., Dlugach, J. M., & Liu, L. 2009, Phy. Rev. A, 80, 053824 [Google Scholar]
- Muñoz, O., Moreno, F., Guirado, D., et al. 2011, Icarus, 211, 894 [Google Scholar]
- Muñoz, O., Moreno, F., Guirado, D., et al. 2012, JQSRT, 113, 565 [Google Scholar]
- Nelson, R. M., Hapke, B. W., Smythe, W. D., & Horn, L. J. 1998, Icarus, 131, 223 [NASA ADS] [CrossRef] [Google Scholar]
- Nelson, R., Hapke, B., Smythe, W., & Spilker, L. 2000, Icarus, 147, 545 [NASA ADS] [CrossRef] [Google Scholar]
- Nelson, R. M., Boryta, M. D., Hapke, B. W., et al. 2018, Icarus, 302, 483 [NASA ADS] [CrossRef] [Google Scholar]
- Ohtake, M., Matsunaga, T., Yokota, Y., et al. 2010, Space Sci.Rev., 154, 57 [Google Scholar]
- Ohtake, M., Pieters, C., Isaacson, P., et al. 2013, Icarus, 226, 364 [NASA ADS] [CrossRef] [Google Scholar]
- Piatek, J. L., Hapke, B. W., Nelson, R. M., Smythe, W. D., & Hale, A. S. 2004, Icarus, 171, 531 [NASA ADS] [CrossRef] [Google Scholar]
- Pieters, C. M., Boardman, J., Buratti, B., et al. 2009, Current Sci., 500, 762 [Google Scholar]
- Pieters, C., Boardman, J., Ohtake, M., et al. 2013, Icarus, 226, 951 [NASA ADS] [CrossRef] [Google Scholar]
- Pommerol, A., Thomas, N., Jost, B., et al. 2013, J. Geophys. Res. Planets, 118, 2045 [Google Scholar]
- Qian, Y., Xiao, L., Zhao, J., et al. 2024, Icarus, 410, 115892 [NASA ADS] [CrossRef] [Google Scholar]
- Robinson, M. S., Brylow, S., Tschimmel, M. e., et al. 2010, Space Sci. Rev., 150, 81 [CrossRef] [Google Scholar]
- Saiki, K., Saito, K., Okuno, H., et al. 2008, Earth Planets Space, 60, 417 [NASA ADS] [CrossRef] [Google Scholar]
- Schröder, S. E., Grynko, Y., Pommerol, A., et al. 2014, Icarus, 239, 201 [Google Scholar]
- Shepard, M. 2001, Lunar Planet. Sci., XXXII, 80 [Google Scholar]
- Shkuratov, Y. G., & Opanasenko, N. 1992, Icarus, 99, 468 [NASA ADS] [CrossRef] [Google Scholar]
- Shkuratov, Y., Bondarenko, S., Ovcharenko, A., et al. 2006, JQSRT, 100, 340 [NASA ADS] [CrossRef] [Google Scholar]
- Shkuratov, Y., Kaydash, V., Korokhin, V., et al. 2011, P&SS, 59, 1326 [Google Scholar]
- Shkuratov, Y., Kaydash, V., Korokhin, V., et al. 2012, JQSRT, 113, 2431 [NASA ADS] [CrossRef] [Google Scholar]
- Wagner, R., Speyerer, E., Robinson, M., team, L., et al. 2015, Ann. Lunar Planet. Sci. Conf., 1832, 1473 [Google Scholar]
- Wang, Z., Wu, Y., Blewett, D. T., et al. 2017, Geophys. Res. Lett., 44, 3485 [NASA ADS] [CrossRef] [Google Scholar]
- Wu, Y., Chai, Y., Lu, Y., et al. 2024, A&A, 682, A112 [NASA ADS] [CrossRef] [EDP Sciences] [Google Scholar]
- Xu, J., Wang, M., Lin, H., et al. 2022, Geophys. Res. Lett., 49, e2021GL096876 [Google Scholar]
- Zhang, H., Yang, Y., Yuan, Y., et al. 2015, Geophys. Res. Lett., 42, 6945 [Google Scholar]
- Zhang, H., Jin, W., Jiang, T., Yang, Y., & Ma, P. 2022, in Springer Series in Light Scattering, Light Polarization and Multiple Scattering in Turbid Media (Berlin: Springer), 8, 47 [Google Scholar]
Appendix A Comparisons of measurements made by the three color-goniometer and the spectral goniometer
Figure A.1 shows the REFF in 633 nm measured by the three-color goniometer at four incident zenith angles. Figure A.2 shows comparisons of the REFF and color ratios measured by the three-color goniometer and the spectro-goniometer.
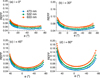 |
Fig. A.1 REFF of the CE5 sample measured using the three-color goniometer at three wavelengths (473, 532, and 633 nm), shown for four incident zenith angles: (a) i = 0°, (b) i = 30°, (c) i = 45°, and (d) i = 60°. |
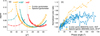 |
Fig. A.2 Comparisons of REFF curves (a) and normalized color ratio curves (b) for the CE5 sample measured using the three-color goniometer and the spectro-goniometer. In panel (b), the blue curves represent measurements from the three-color goniometer at four incident zenith angles (i = 0°, 30°, 45°, and 60°), while the orange curves represent measurements from the spectro-goniometer at two incident zenith angles (i = 30° and 45°). All curves are normalized to 1 at their respective minimum phase angles: 3° for the three-color goniometer and 10° for the spectro-goniometer. |
Appendix B Thermal emission removal
The reflectance and emission components of lunar radiance overlap in the spectral range of 2 μm to 3 μm. Thermal emission can alter the spectral slope and the shape of absorption features, complicating the interpretation of reflected data. To enable comparison between in situ reflectance spectra measured by CE5 LMS, laboratory spectra of returned samples, and Earth-based telescopic observations, we first removed the thermal emission component from the CE5 spectra using the method proposed by (Shkuratov et al. 2011). When thermal equilibrium is reached, the lunar surface radiance received by a detector is given by
 (B.1)
(B.1)
where the first term on the right-hand side of the equation represents the reflectance component, and the second term corresponds to thermal emission. In this context, An(λ), F(i, e, α, λ), and ε(e, λ) denote the normal albedo of the lunar surface, the photometric function, and the directional emissivity. The variables i, e, α, and λ refer to the incident zenith angle, emission (viewing zenith) angle, phase angle, and wavelength, respectively. E0(λ) and B0(λ, T) represent the solar spectral irradiance (Gueymard 2014) and the spectral radiance of a blackbody as given by the Planck function
 (B.2)
(B.2)
where h, c, k, and T are the Planck constant, the speed of light in vacuum, the Boltzmann constant, and the surface equilibrium temperature, respectively. The radiance factor IoF can be obtained by multiplying Equation (B.1) by π and dividing by the solar spectral irradiance E0(2):
 (B.3)
(B.3)
The equilibrium temperature can be calculated as (Hapke 2012)
![Mathematical equation: T = \left[ \frac{C (1 - r_{dh}) \cos(i)}{\sigma \epsilon_{dh} d_{AU}^2} \right]^{1/4},](/articles/aa/full_html/2026/01/aa55761-25/aa55761-25-eq15.png) (B.4)
(B.4)
where C, σ, 6dh, and dAU denote the solar constant (1367 W/m2), the Stefan-Boltzmann constant, the directional-hemispherical emissivity (set to 1 in this work), and the Sun-Moon distance in AU. Since the function F(i, e, α, λ) depends only weakly on λ, it is approximated as F(i, e, α) ≈ F(i, e, α, λ). The emissivity 6(e,λ), the directional-hemispherical reflectance rdh, and the photometric function F(i, e, α) are related by
 (B.5)
(B.5)
 (B.6)
(B.6)
 (B.7)
(B.7)
 (B.8)
(B.8)
By assuming that the photometric properties of the CE5 landing site follow the Lommel-Seeliger law,  , the photometric function can be specified accordingly. Since the thermal component at the wavelength λm = 0.5 μm is negligible, the second term on the right side of Equation (B.3) can be omitted. Using the measured radiance at λm = 0.5 μm, one can solve for An(λm), which is then substituted into Equations (B.6) and (B.4) to determine the surface equilibrium temperature T. Finally, the thermal emission component can be removed using Equation (B.3).
All Tables
Comparisons of relative mineral abundances of the CE5 samples and landing site retrieved from different sources.
All Figures
|
Fig. 1 Photos of the CE5 regolith layer surface. (a) Top view; (b) Illuminated by a 633 nm He-Ne laser at 60° incident zenith angle. |
| In the text | |
|
Fig. 2 Schematic of the optical path and measurement geometry of the three-color goniometer. M1, M2, and M3 are mirrors that direct the laser beams into the optical fiber. The angles i, e, α, and n denote the incident zenith angle, viewing zenith angle, phase angle, and surface normal vector, respectively. LP1 and LP2 are linear polarizers for the incident and viewing beams. λ/2 WP and λ/4 WP indicate the halfwave plate and quarter-wave plate, respectively. |
| In the text | |
|
Fig. 3 REFF measured by the three-color goniometer (a)(b) and the spectro-goniometer (c)(d), all in 633 nm. (a) Measurement made within the principal plane at four incident zenith angles: 0°, 30°, 45°, 60°; (b) REFF normalized at the smallest phase angle (~3°); (c) REFF measured by the spectro-goniometer in the upper hemisphere at i = 30° and (d) i = 45°. The image data shown in (c) and (d) were interpolated from ~100 discrete measurement points. In each image plot, the radial distance from the center represents the zenith angle, and the azimuth angle measured from due north represents the relative azimuth angle. The incident zenith directions are indicated by orange dots. The backward and forward scattering directions are along the azimuth angles of 0° and 180°, respectively. |
| In the text | |
|
Fig. 4 Color ratios of the CE5 soil measured by the three-color goniometer (a)(b) and by the spectro-goniometer (c)(d). The color ratios between 633 and 473 nm with (a) absolute value and (b) normalized at the smallest phase angle (~3°). The color ratios between 500 and 800 nm with (c) i = 30° and (d) i = 45°. In each image plot, the radial distance from the center represents the zenith angle, and the azimuth angle measured from due north represents the relative azimuth angle. The incident zenith directions are indicated by orange dots. The backward and forward scattering directions are along the azimuth angles of 0° and 180° , respectively. |
| In the text | |
|
Fig. 5 Polarization curves of the CE5 soil vs phase angles measured by the three-color goniometer at four incident angles. (a) DOLP with Pmax ~ 16% at 633 nm and ~21% at 532 nm; (b) DOCP curves at 633 nm and 532 nm. The shaded regions indicate measurement uncertainties. |
| In the text | |
|
Fig. 6 VNIR and MIR relative reflectance spectra of the CE5 sample and comparison with those of laser-irradiated JSC-1A lunar regolith simulant (LRS). (a) Relative reflectance spectra; (b) Reflectance spectra normalized to 1 at 0.7 μm. The inset in (a) highlights the position of the Christiansen feature. |
| In the text | |
|
Fig. 7 Reduced reflectance curves of the CE5 soil measured at different incident angles and compared with previous measurements on JSC-1A LRS Jiang et al. (2019), in situ extracted curve from the CE3 (Jin et al. 2015) and CE4 (Jiang et al. 2021) missions, and laboratory-measured Apollo samples by the Bloomsburg University Goniometer (Shepard 2001; Foote et al. 2020). All curves are normalized at −3° phase angle. |
| In the text | |
|
Fig. 8 Comparison of the albedo A vs. Pmax for the CE5 sample at 633 and 532 nm (this work), ground-based observation at 558.6 nm (Jeong et al. 2015), and laboratory measurements on the Apollo and Luna samples at 580 nm (Geake & Dollfus 1986). The parameters for the empirical lines are from Geake & Dollfus (1986). |
| In the text | |
|
Fig. 9 Comparisons of the DOCP measurements in 633 nm for the CE5 regolith with those of the Apollo samples at small phase angles measured by Hapke et al. (1993), and with the JSC-1A LRS (Escobar-Cerezo et al. 2018) measured in a single-scattering configuration (Muñoz et al. 2012), are shown as follows: (a) DOCP curves of the Apollo samples and the CE5 regolith; (b) averaged DOCP values between 0° and 18° phase angle vs normal albedo at different wavelengths; (c) DOCP curves of CE5 regolith compared with those of JSC-1A LRS measured in the single-scattering configuration; (d) the M44/M11 element for JSC-1A LRS and other samples (e.g., olivine, forsterite, palagonite, allende, basalt, calcite) measured in single-scattering configuration by Muñoz et al. (2012), along with the corresponding values for CE5 retrieved from Eq. (11). |
| In the text | |
|
Fig. 10 VNIR reflectance spectrum of the CE5 sample and comparison with those of the in situ measurements by the spectrometer (LMS) on board the CE5 lander, the ground-based telescope (TLSCP) observation (Flom et al. 2022), and the orbital data from M3 (Pieters et al. 2009) for the landing site (LS) (6 × 6 pixels), the region sampled in Flom et al. (2022). (a) Reflectance values; (b) Reflectance normalized to 1 at 2.3 μm; (c) Map showing the CE5 landing site and the region approximately where Flom et al. (2022) sampled the spectra. The base map is from the Lunar Reconnaissance Orbiter Camera (Robinson et al. 2010; Wagner et al. 2015). |
| In the text | |
|
Fig. 11 Continuum-removed Chang’e-5 lander spectrum (blue dots) compared with the best-matching LUT synthetic spectra, determined using four different fitting metrics: ABS, NABS, CPRMS, and SAM. |
| In the text | |
|
Fig. A.1 REFF of the CE5 sample measured using the three-color goniometer at three wavelengths (473, 532, and 633 nm), shown for four incident zenith angles: (a) i = 0°, (b) i = 30°, (c) i = 45°, and (d) i = 60°. |
| In the text | |
|
Fig. A.2 Comparisons of REFF curves (a) and normalized color ratio curves (b) for the CE5 sample measured using the three-color goniometer and the spectro-goniometer. In panel (b), the blue curves represent measurements from the three-color goniometer at four incident zenith angles (i = 0°, 30°, 45°, and 60°), while the orange curves represent measurements from the spectro-goniometer at two incident zenith angles (i = 30° and 45°). All curves are normalized to 1 at their respective minimum phase angles: 3° for the three-color goniometer and 10° for the spectro-goniometer. |
| In the text | |
Current usage metrics show cumulative count of Article Views (full-text article views including HTML views, PDF and ePub downloads, according to the available data) and Abstracts Views on Vision4Press platform.
Data correspond to usage on the plateform after 2015. The current usage metrics is available 48-96 hours after online publication and is updated daily on week days.
Initial download of the metrics may take a while.