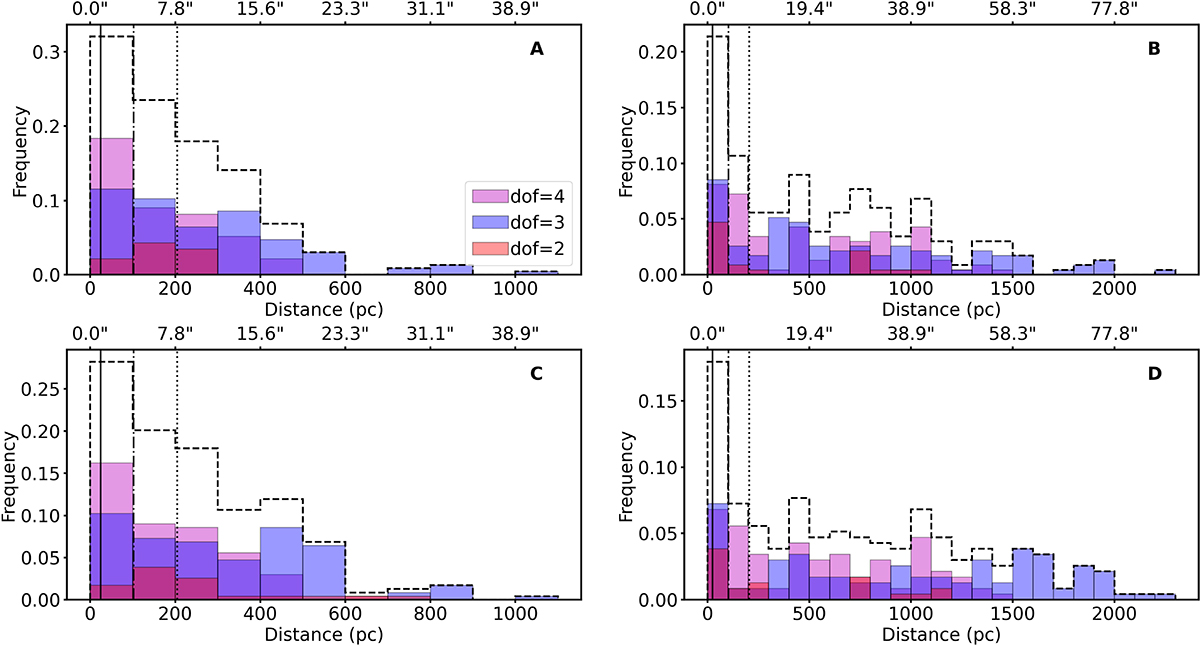
Fig. 10.
Download original image
Distance distributions. Panels A and B show the simple projected 2D distance between our stars and the nearest star cluster and OB association, respectively. Panels C and D show the distances from the nearest star cluster or OB association that differ by 5 Myr at most from the estimated stellar ages. The sample is color-coded according to the degree of freedom, and each histogram is normalized to the total number of stars in the sample. The dashed black histogram shows the total frequency. All bins have an equal size of 100 pc. The vertical black lines show the distances that a star can travel in 1 Myr with a constant velocity of 24 km s−1, 100 km s−1, and 200 km s−1. These distances are 24, 102, and 204 pc.
Current usage metrics show cumulative count of Article Views (full-text article views including HTML views, PDF and ePub downloads, according to the available data) and Abstracts Views on Vision4Press platform.
Data correspond to usage on the plateform after 2015. The current usage metrics is available 48-96 hours after online publication and is updated daily on week days.
Initial download of the metrics may take a while.