Fig. 2.
Download original image
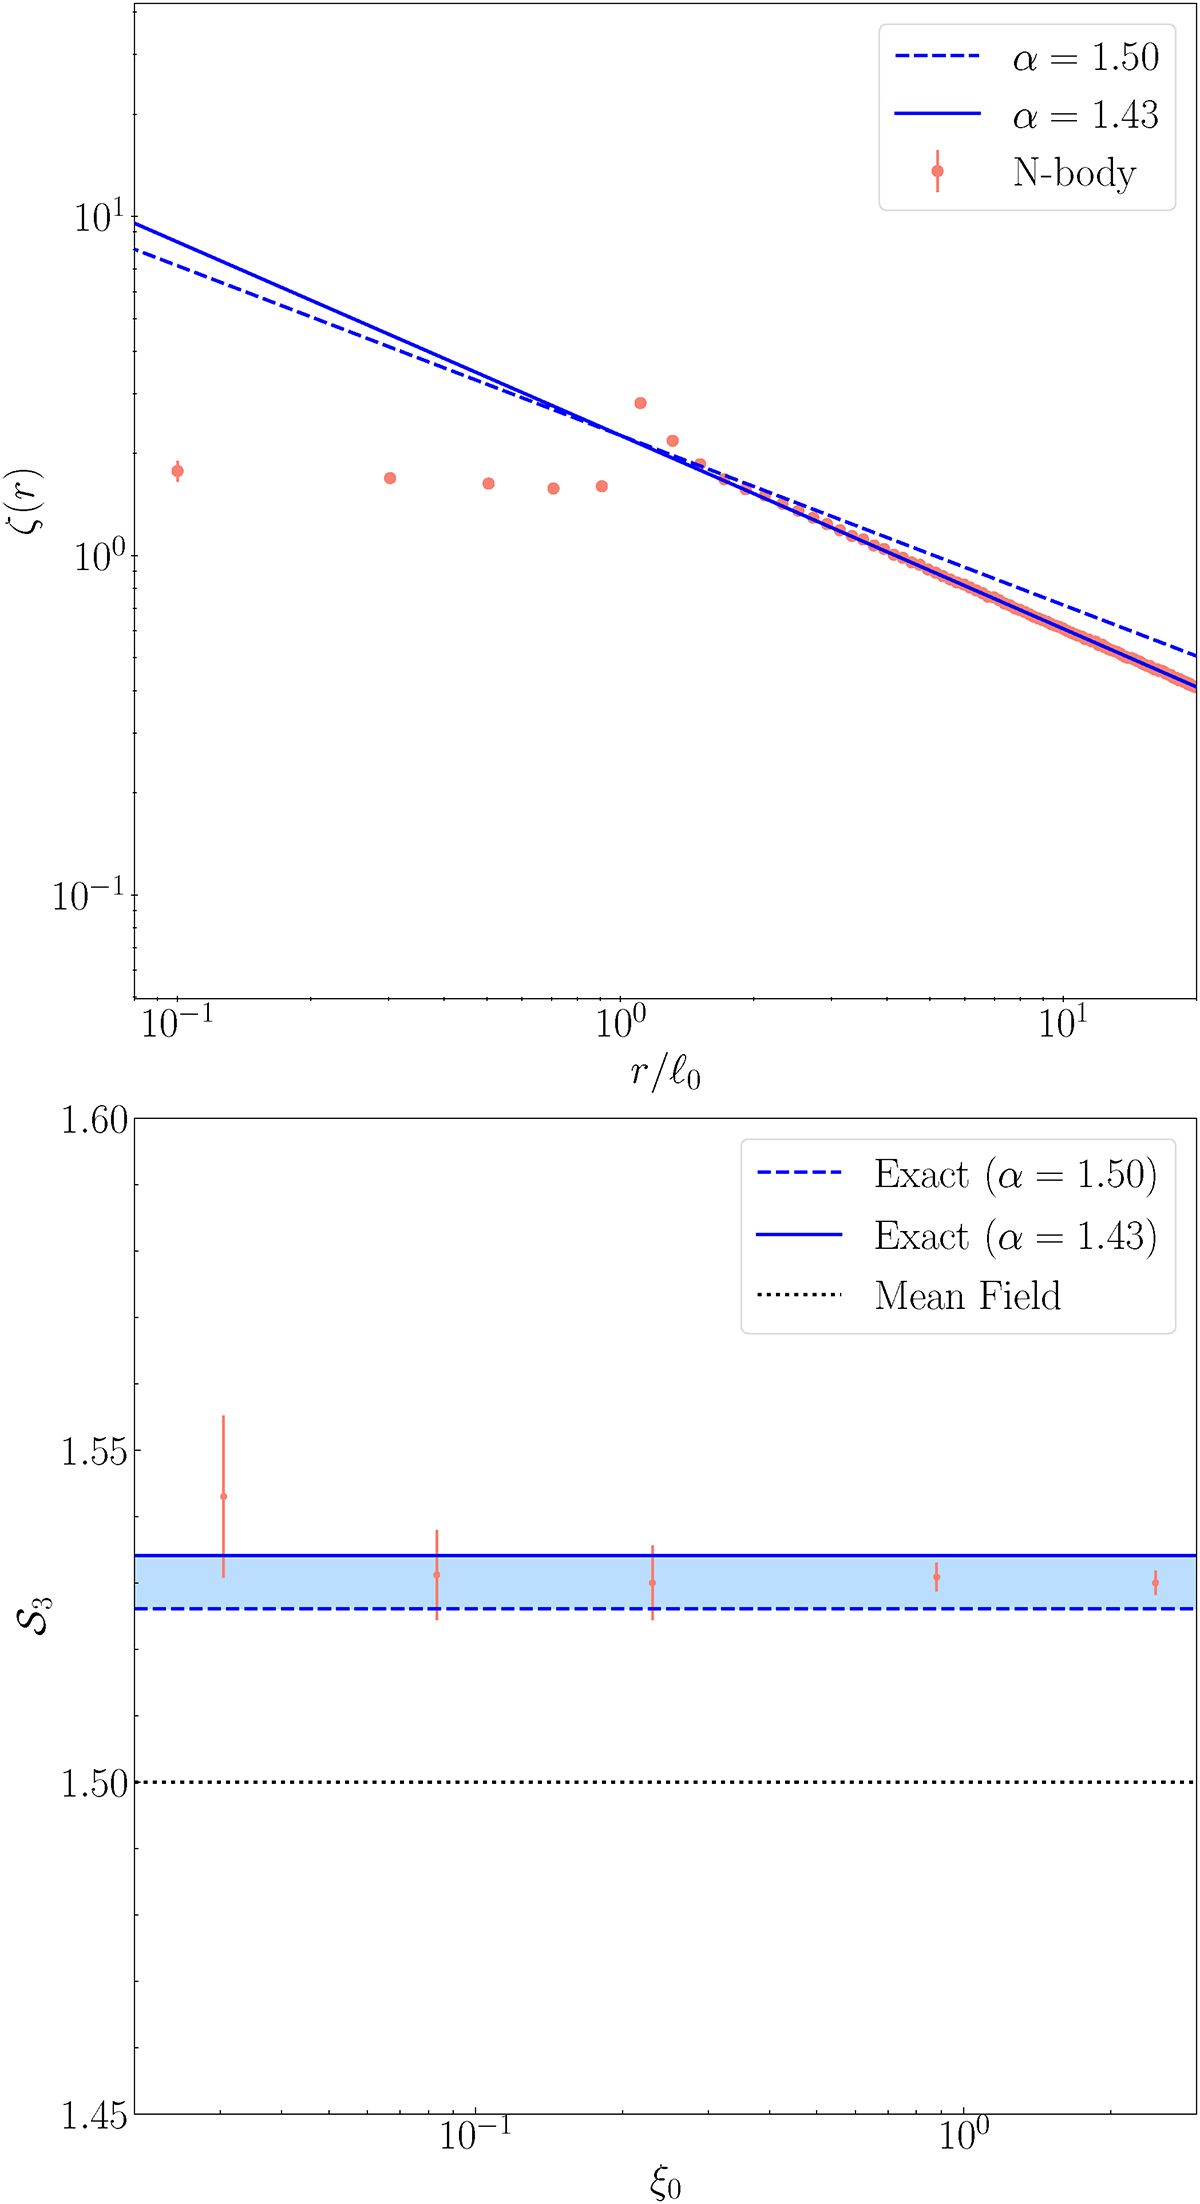
Top panel: Measured correlation function for Lévy flights with α = 1.5, ℓ0 = 0.02 (red points and error bars). The dashed blue line is the expected large r ≫ ℓ0 behaviour ζ(r)∼rα − D, but the actual dependence is slightly steeper, with an effective measured power law α ≃ 1.43 (solid blue line). Bottom panel: Measured Skewness 𝒮3 from Lévy flights with different ξ0 variances (red points and error bars) with α = 3/2. The error bars correspond to the error on the mean from Nreal = 100 realisations each. The BMF prediction yields a better fit to the measured skewness compared to the MF (dashed black line), but there is a slight ambiguity in recovering the exact BMF prediction due to the α dependence of the statistic (cf. solid, dashed blue lines and shaded blue region).
Current usage metrics show cumulative count of Article Views (full-text article views including HTML views, PDF and ePub downloads, according to the available data) and Abstracts Views on Vision4Press platform.
Data correspond to usage on the plateform after 2015. The current usage metrics is available 48-96 hours after online publication and is updated daily on week days.
Initial download of the metrics may take a while.