Fig. 4.
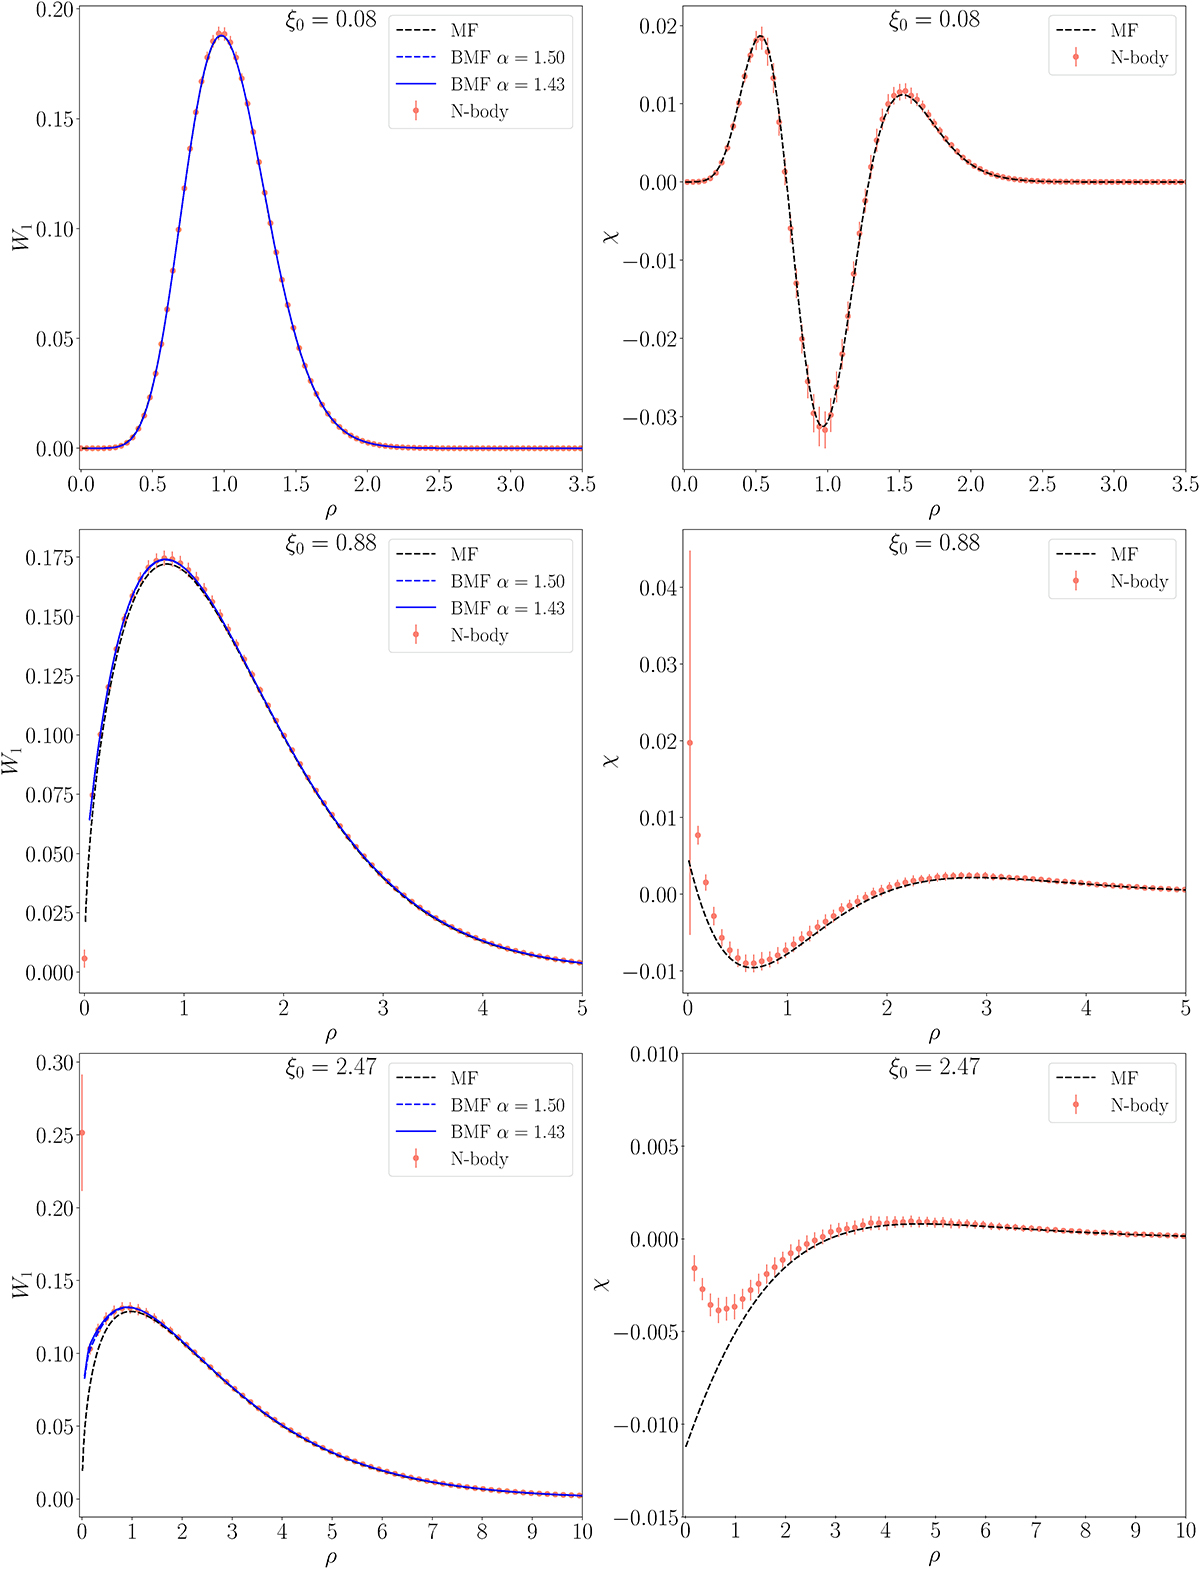
Download original image
Left: Excursion set perimeter length, W1. Right: Euler characteristic – measured (red points and error bars), mean-field expectation value (dashed black lines) and BMF with α = 1.5 (dashed blue lines) and α = 1.43 (solid blue lines). The error bars represent the standard deviation, and the points are the sample means. The top to bottom panels are the cases ξ0 = 0.08, 0.88, 2.47, respectively, with the parameters Δ = 0.25, R = 1, L = 4000 × Δ, α = 3/2, and Npts = 40 × 20002. Once again the agreement is excellent, especially at the high-density end. Note that the BMF prediction for χ (right panels) is beyond the scope of this paper.
Current usage metrics show cumulative count of Article Views (full-text article views including HTML views, PDF and ePub downloads, according to the available data) and Abstracts Views on Vision4Press platform.
Data correspond to usage on the plateform after 2015. The current usage metrics is available 48-96 hours after online publication and is updated daily on week days.
Initial download of the metrics may take a while.