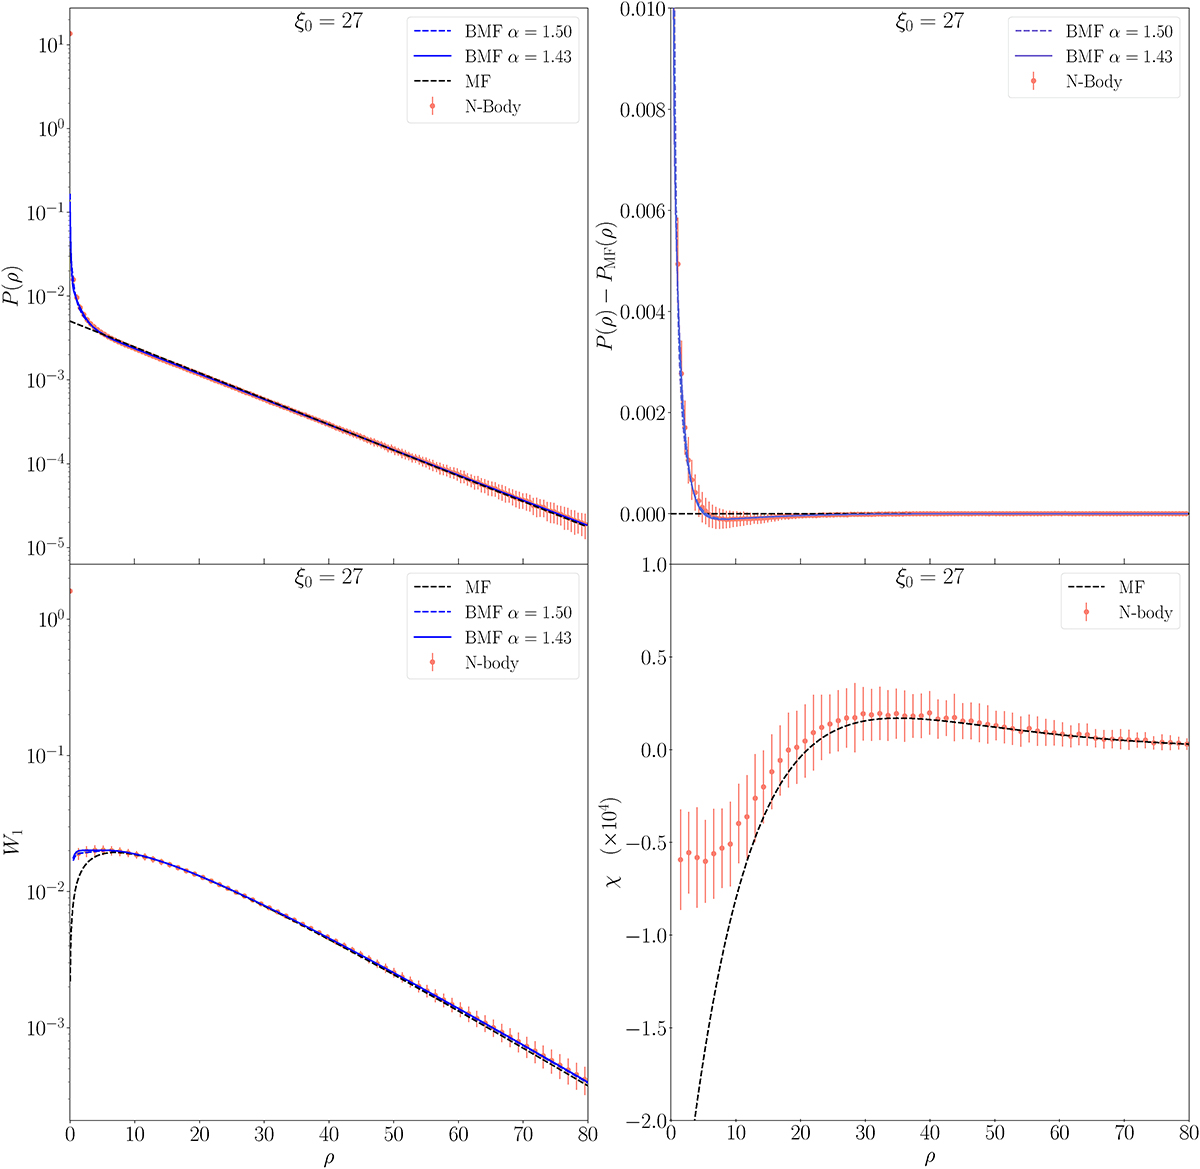
Fig. 5.
Download original image
Summary statistics, P(ρ) (top left), W1 (bottom left), and χ (bottom right), for a set of Nreal = 100 realisations of a highly non-Gaussian field with ξ0 = 27 and other parameters of Δ = 0.25, R = 1, L = 4000 × Δ, α = 3/2, and Npts = 40 × 20002. The difference between P(ρ) and the MF prediction is also presented (top right). Error bars show the standard deviation, and the points the sample means. The BMF estimates of the PDF (solid blue lines, top panels) and W1 (bottom left panel) remain an excellent approximation for ξ0 > 20. The MF limit is a good approximation for all statistics in the high-density tails.
Current usage metrics show cumulative count of Article Views (full-text article views including HTML views, PDF and ePub downloads, according to the available data) and Abstracts Views on Vision4Press platform.
Data correspond to usage on the plateform after 2015. The current usage metrics is available 48-96 hours after online publication and is updated daily on week days.
Initial download of the metrics may take a while.