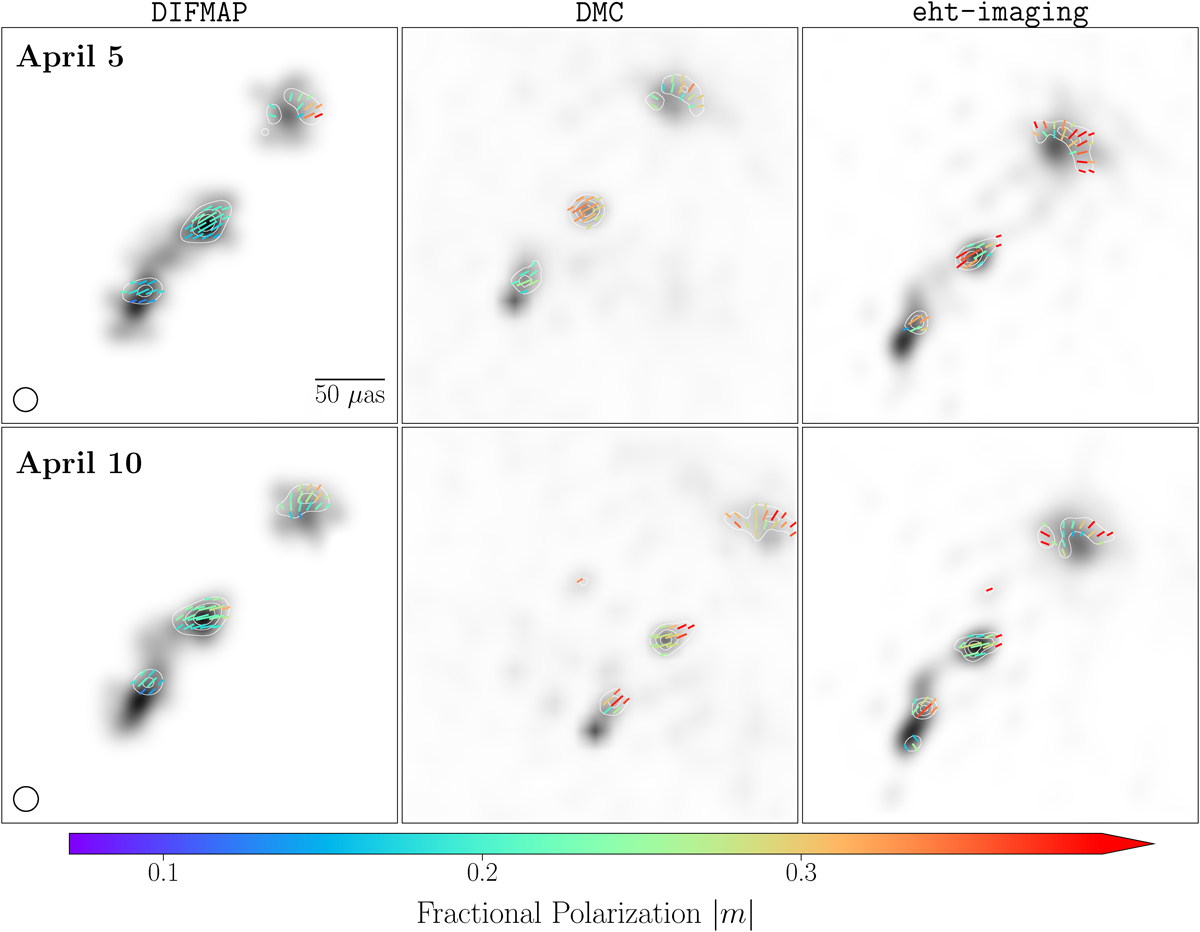
Fig. B.2.
Download original image
Polarimetric images of OJ 287, produced using DIFMAP, DMC, and eht-imaging. Total intensity emission is shown in grayscale, while white contours represent polarization intensity at levels of 25%, 50%, and 75% of the peak polarization intensity. Ticks indicate the orientation of the EVPA, with their length representing the magnitude of linear polarization intensity and their color denoting the fractional linear polarization. EVPAs are shown only where the total and linear polarization intensities exceed their respective noise thresholds, which are ∼0.3 mJy/beam for total intensity and ∼0.5 mJy/beam for linear polarized intensity. The field of view for all images is 300 μas. The DIFMAP images for Stokes I, Q, and U were created by convolving the point source model components with a circular Gaussian of 18 μ as FWHM for both April 5 and April 10, matching the maximum minor axes of the CLEAN beams, which are approximately circular. The resolution of DMC and eht-imaging images for each day was matched to the DIFMAP image resolution, as described in section A.
Current usage metrics show cumulative count of Article Views (full-text article views including HTML views, PDF and ePub downloads, according to the available data) and Abstracts Views on Vision4Press platform.
Data correspond to usage on the plateform after 2015. The current usage metrics is available 48-96 hours after online publication and is updated daily on week days.
Initial download of the metrics may take a while.