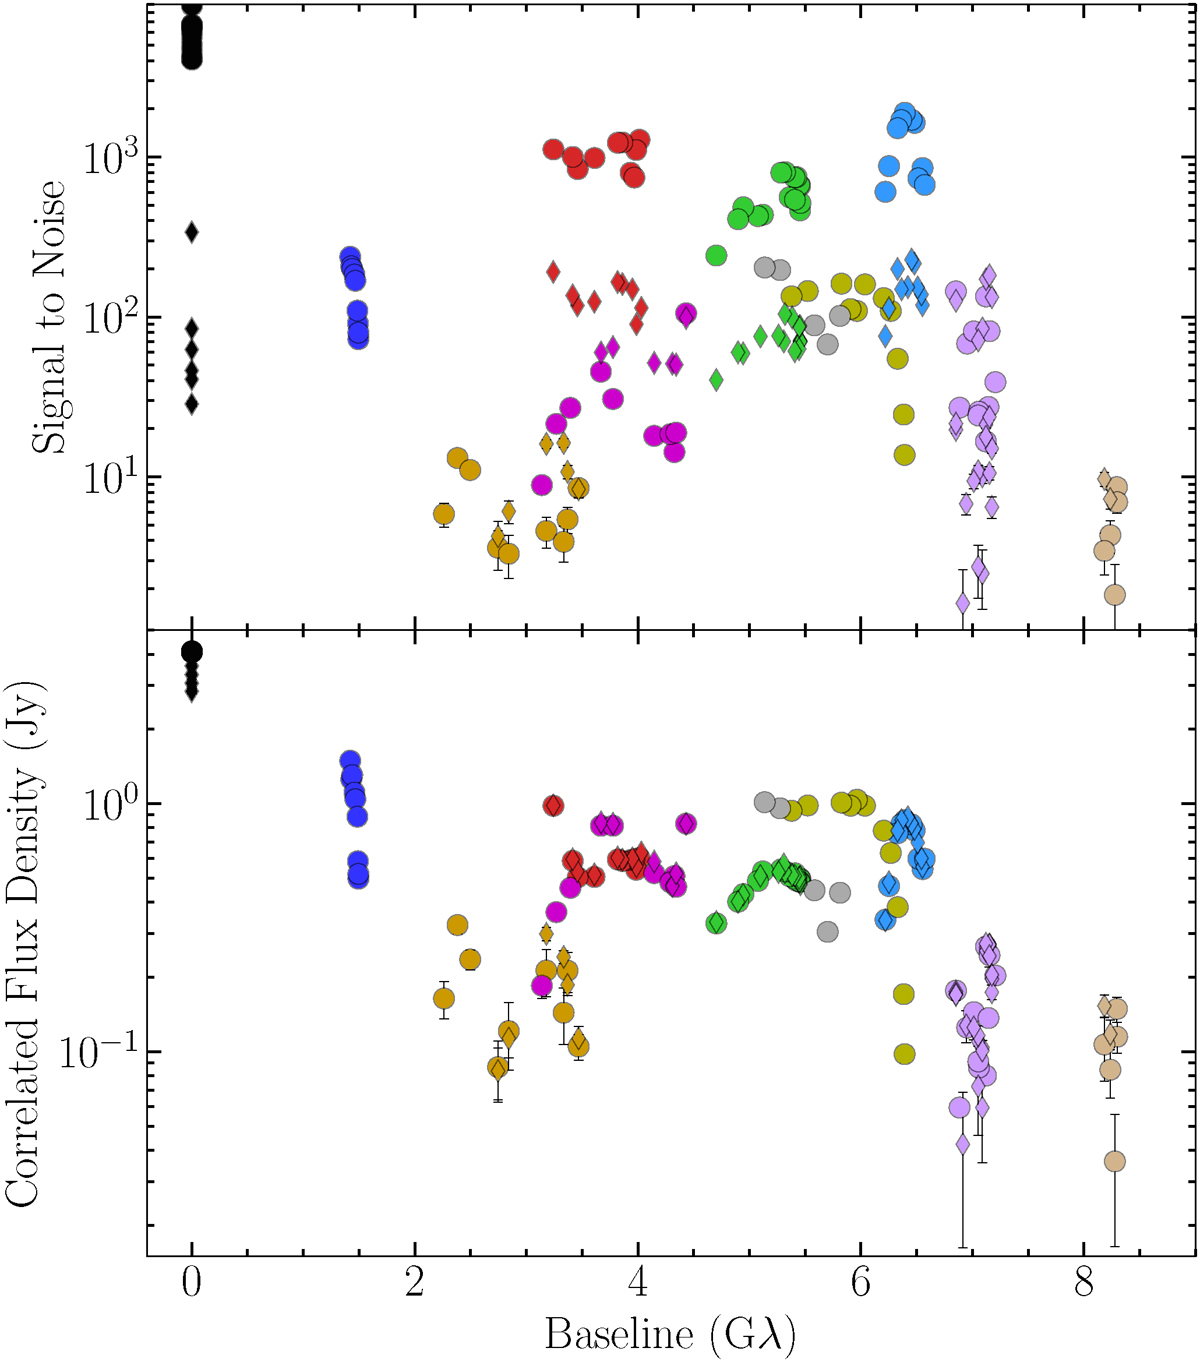
Fig. 2.
Download original image
Signal-to-noise ratio of OJ 287 detections on April 10, 2017 (top panel), and the corresponding visibility amplitudes of the calibrated data set (bottom panel). Both frequency bands are shown, with scan-long (typically ∼5 min) averaging. Colors follow the convention of Fig. 1. Circle markers denote baselines with ALMA or SMA, while diamonds denote similar baselines to APEX or JCMT.
Current usage metrics show cumulative count of Article Views (full-text article views including HTML views, PDF and ePub downloads, according to the available data) and Abstracts Views on Vision4Press platform.
Data correspond to usage on the plateform after 2015. The current usage metrics is available 48-96 hours after online publication and is updated daily on week days.
Initial download of the metrics may take a while.