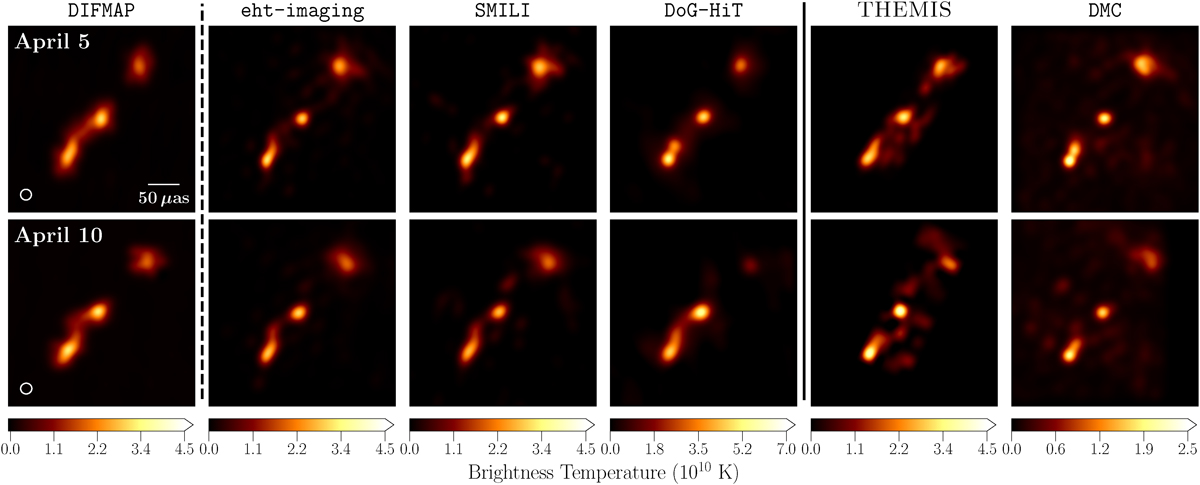
Fig. 3.
Download original image
Total intensity images of OJ 287 on April 5 and 10 for different imaging pipelines. The RML imaging methods are separated by a dashed black line, while the Bayesian imaging methods are separated by a solid black line. The DIFMAP images are convolved with a circular Gaussian of 18 μas, corresponding to the maximum of the minor axes of the CLEAN beams (which are approximately circular) of April 5 and 10. For each day, the image resolution of all images are matched with the DIFMAP image resolution as described in Appendix A.
Current usage metrics show cumulative count of Article Views (full-text article views including HTML views, PDF and ePub downloads, according to the available data) and Abstracts Views on Vision4Press platform.
Data correspond to usage on the plateform after 2015. The current usage metrics is available 48-96 hours after online publication and is updated daily on week days.
Initial download of the metrics may take a while.