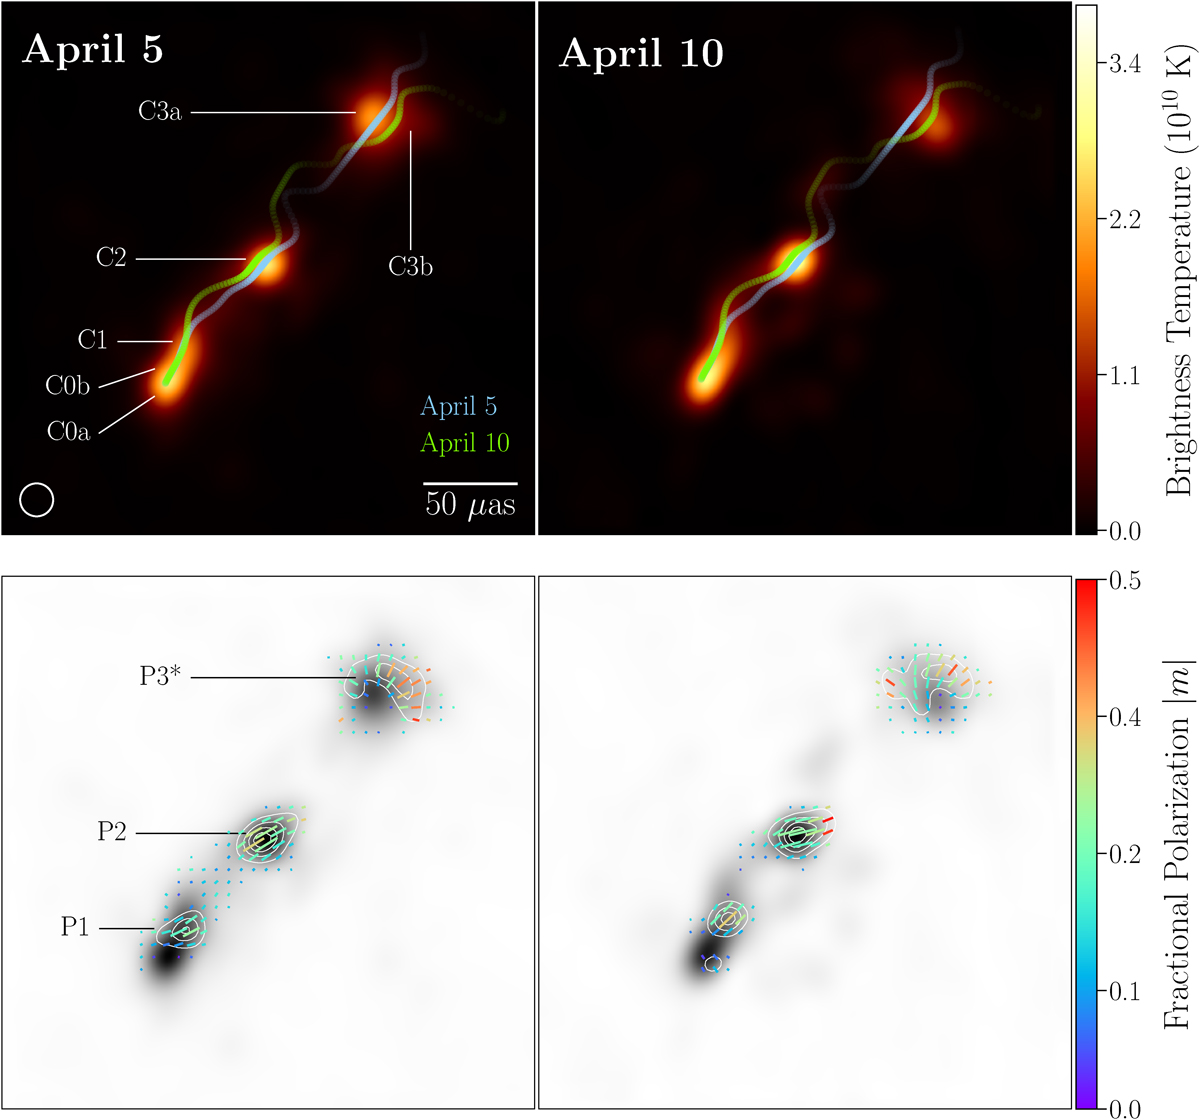
Fig. 4.
Download original image
Mean total intensity (top) and linear polarization (bottom) images of OJ 287 on April 5 (left) and 10 (right). Total intensity image is averaged across six different imaging methods for each day using the images from Figure 3. The color scale is the same for both days in units of brightness temperature, as shown at the right color bar. Model-fit components (see Sect. 3.1 and Table 1) are labeled in the April 5 image. Ridgelines (see Sect. 3.1 are shown for both epochs (April 5 and 10 with green and white, respectively). The effective resolution, 18 μas, is shown at the bottom, left corner of the first panel. The linear polarization image is averaged across three imaging methods of DIFMAP, DMC, and eht-imaging (see Appendix B and Figure B.2). The grayscale image shows the total intensity for comparison, while white contours represent polarization intensity at 20, 40, 60, and 80% of the peak value. Ticks indicate linear polarization, with their length corresponding to flux density, angle representing EVPAs, and color denoting fractional polarization, as shown in the color bar on the right. The fit components in polarization (see Sect. 3.2 and Table 2) are labeled in the April 5 image. Components P1, P2, and P3* correspond to the model-fit components C1, C2, and the complex region that includes C3a and C3b, respectively.
Current usage metrics show cumulative count of Article Views (full-text article views including HTML views, PDF and ePub downloads, according to the available data) and Abstracts Views on Vision4Press platform.
Data correspond to usage on the plateform after 2015. The current usage metrics is available 48-96 hours after online publication and is updated daily on week days.
Initial download of the metrics may take a while.