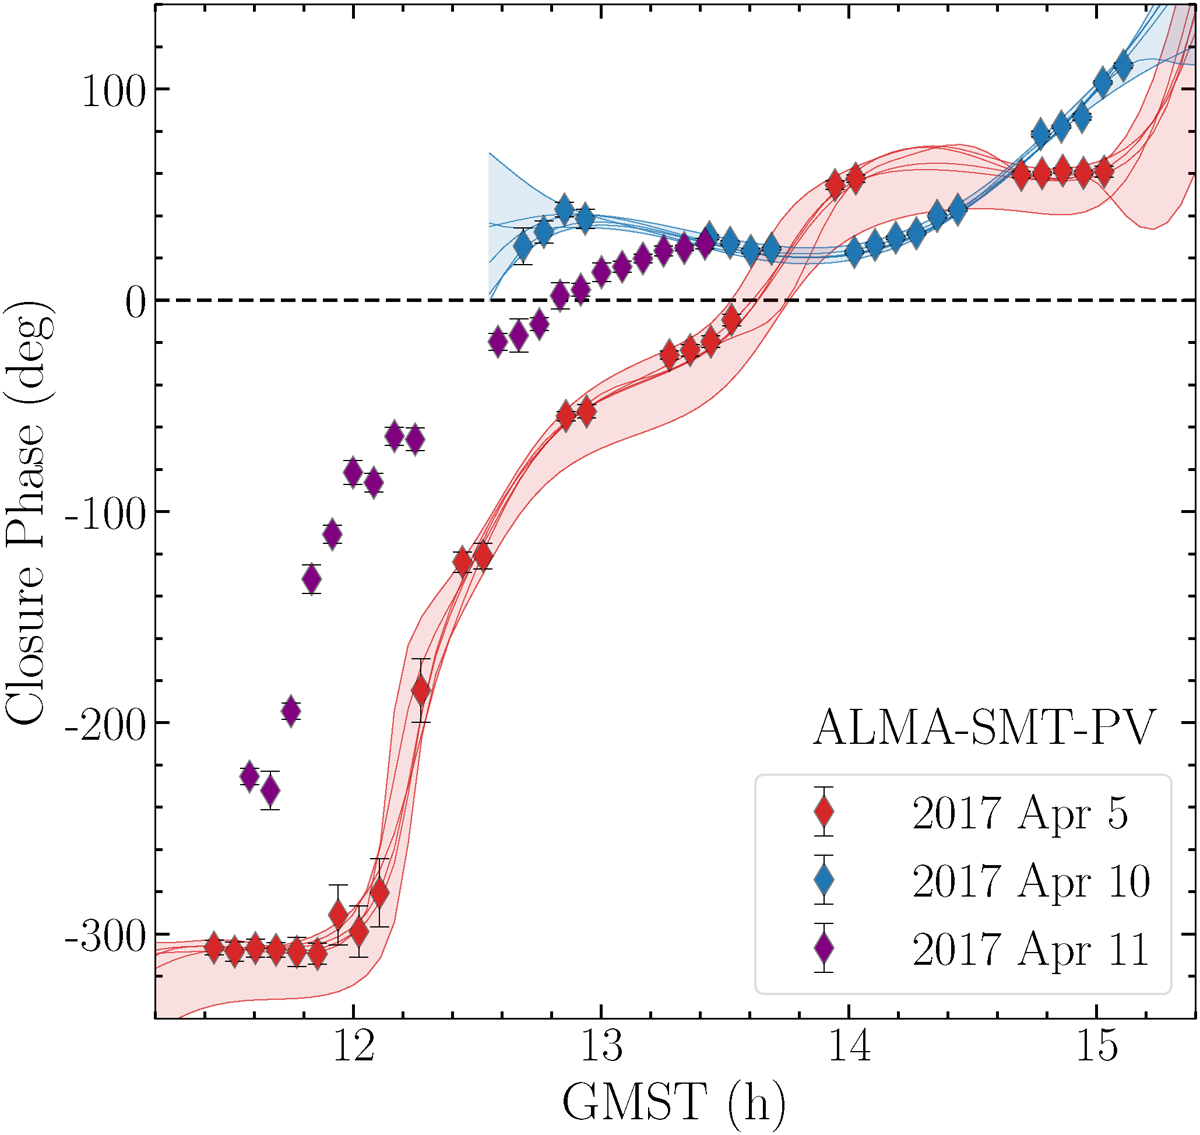
Fig. 7.
Download original image
Closure phases measured on a wide triangle between ALMA, SMT, and Pico Veleta. The data shown correspond to the LO band, averaged coherently in 300 s segments before calculating closure products. Continuous lines represent the closure phase values predicted by models obtained by averaging the results from six different imaging algorithms for April 5 and 10, 2017, as shown in Sect. 2.2. The range of modeling predictions for each observing day is shaded. Interday variation of closure phase values indicates the time evolution of the source morphology.
Current usage metrics show cumulative count of Article Views (full-text article views including HTML views, PDF and ePub downloads, according to the available data) and Abstracts Views on Vision4Press platform.
Data correspond to usage on the plateform after 2015. The current usage metrics is available 48-96 hours after online publication and is updated daily on week days.
Initial download of the metrics may take a while.