Fig. 8.
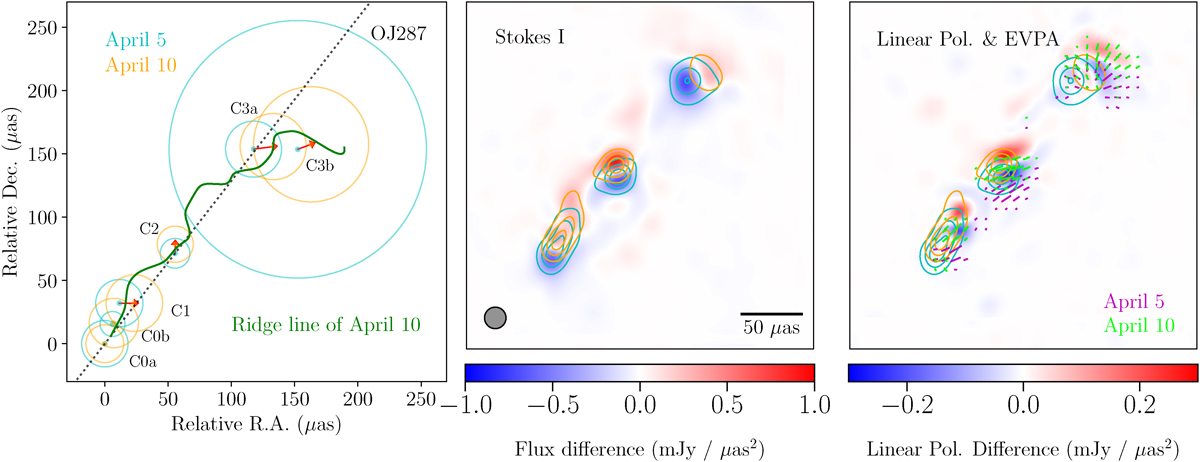
Download original image
(Left) Fit circular Gaussian model components (full-width half maximum) for April 5 (cyan) and 10 (orange). The relative position of the components are referenced to the innermost component, C0a. The red arrow shows the motion of each component from April 5 to 10, and the solid green line shows the ridgeline of April 10. The broken black line indicates the jet direction obtained by connecting the components’ positions of C0a, C2, and C3a of April 5. (Middle) The Stokes I image difference between epochs (i.e., Iij(Apr. 10) − Iij(Apr. 5), where Iij is the intensity at a pixel (i, j)). The color scale is shown at the bottom of the panel. Note that the flux changes are consistent with the motion of components. (Right) Same as the middle panel but for the linear polarization. The EVPAs at each epoch are shown together (purple and green for April 5 and 10, respectively). The contours in the middle and right panels show the Stokes I structure on April 5 (cyan) and 10 (orange), which are set to 25, 50, 75% of the peak intensity.
Current usage metrics show cumulative count of Article Views (full-text article views including HTML views, PDF and ePub downloads, according to the available data) and Abstracts Views on Vision4Press platform.
Data correspond to usage on the plateform after 2015. The current usage metrics is available 48-96 hours after online publication and is updated daily on week days.
Initial download of the metrics may take a while.