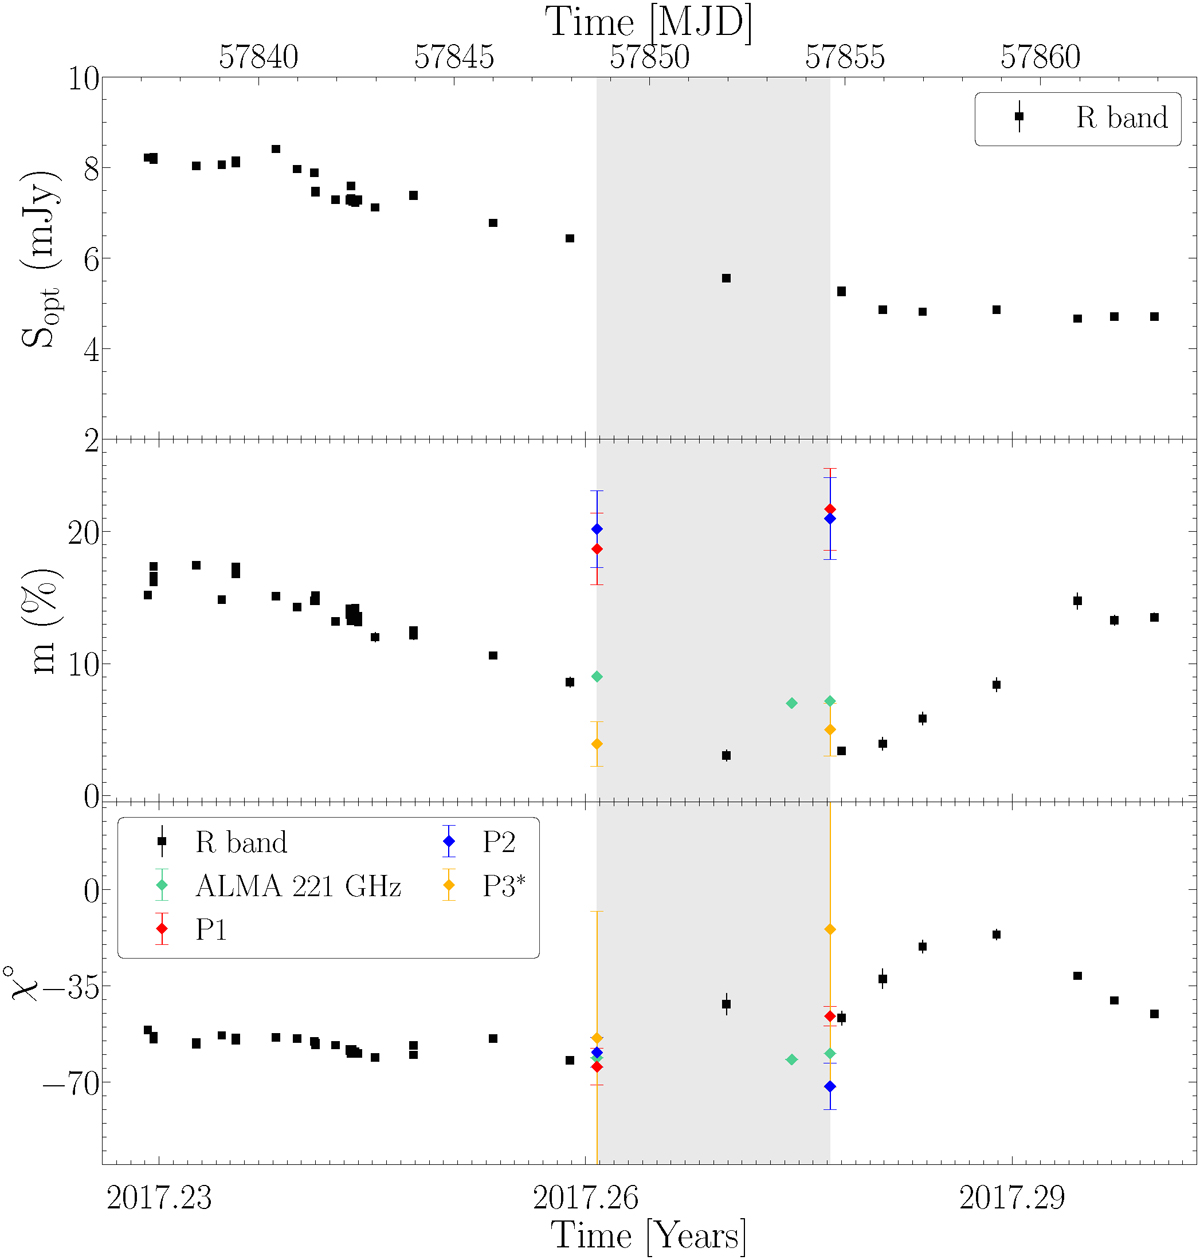
Fig. 9.
Download original image
Measurements of the optical light curve, polarization degree, and position angle of OJ 287 by the 1.8 m Perkins telescope during the EHT campaign. Top panel:R-band optical flux density as a function of time. Middle panel: Degree of polarization in the R band (black), at 221 GHz from ALMA (green) and for individual jet components, P1 (red), P2 (blue), and P3* (orange). Bottom panel: Polarization position angle evolution in the R band (black) and the source-integrated value measured by ALMA at 221 GHz (green) and for the same jet components (P1, P2, and P3*). The gray-shaded region highlights the period corresponding to the EHT observations.
Current usage metrics show cumulative count of Article Views (full-text article views including HTML views, PDF and ePub downloads, according to the available data) and Abstracts Views on Vision4Press platform.
Data correspond to usage on the plateform after 2015. The current usage metrics is available 48-96 hours after online publication and is updated daily on week days.
Initial download of the metrics may take a while.