Fig. 4
Download original image
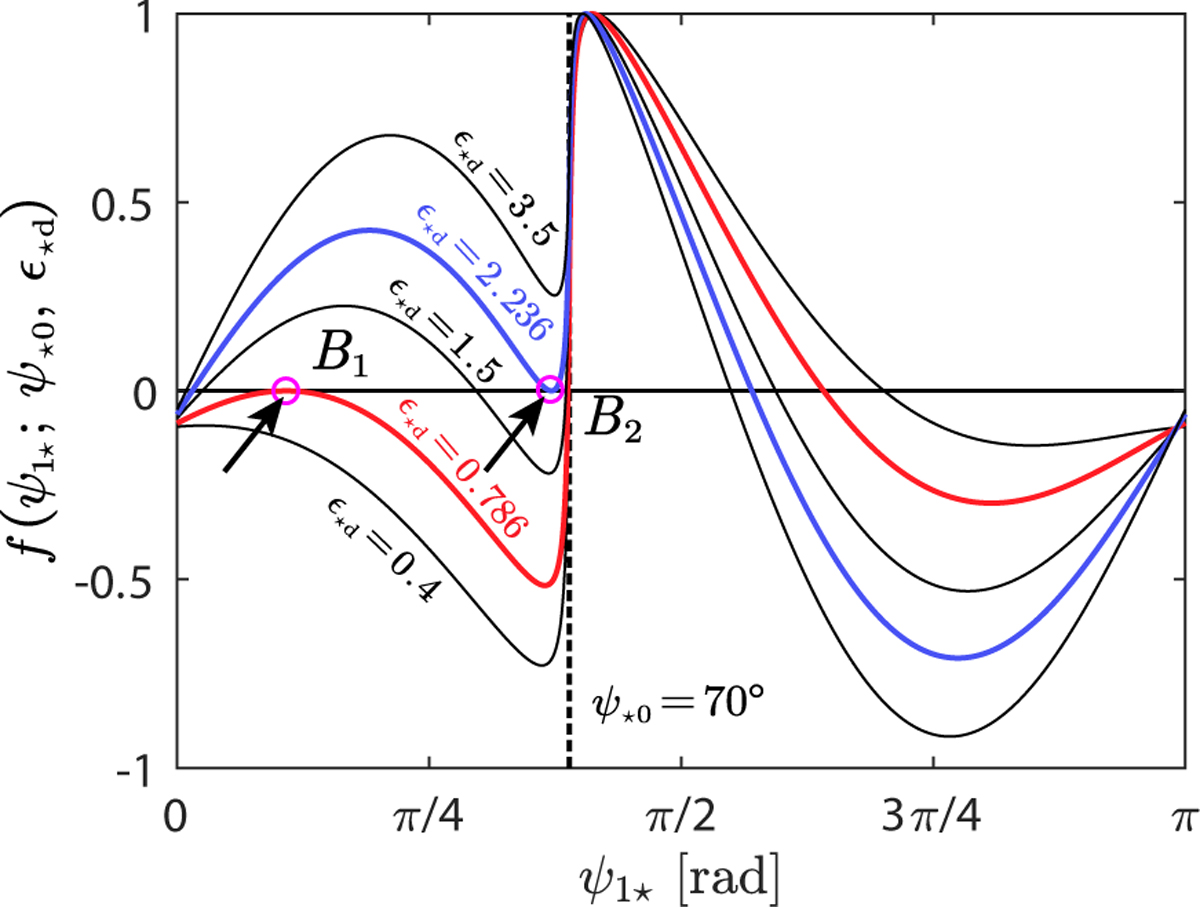
Values of f(ψ1⋆; ψ⋆0, ϵ⋆d) defined by Eq. (23) as functions of ψ1⋆ and ϵ⋆d for ψ⋆0 = 70°. The red and blue curves represent the critical ϵ⋆d that trigger the bifurcations B1 and B2, respectively, which are characterized by f = 0 and df/dψ1⋆ = 0. The two bifurcations are further distinguished by the sign of ![]() : B1 (<0) and B2 (>0).
: B1 (<0) and B2 (>0).
Current usage metrics show cumulative count of Article Views (full-text article views including HTML views, PDF and ePub downloads, according to the available data) and Abstracts Views on Vision4Press platform.
Data correspond to usage on the plateform after 2015. The current usage metrics is available 48-96 hours after online publication and is updated daily on week days.
Initial download of the metrics may take a while.