Fig. 7
Download original image
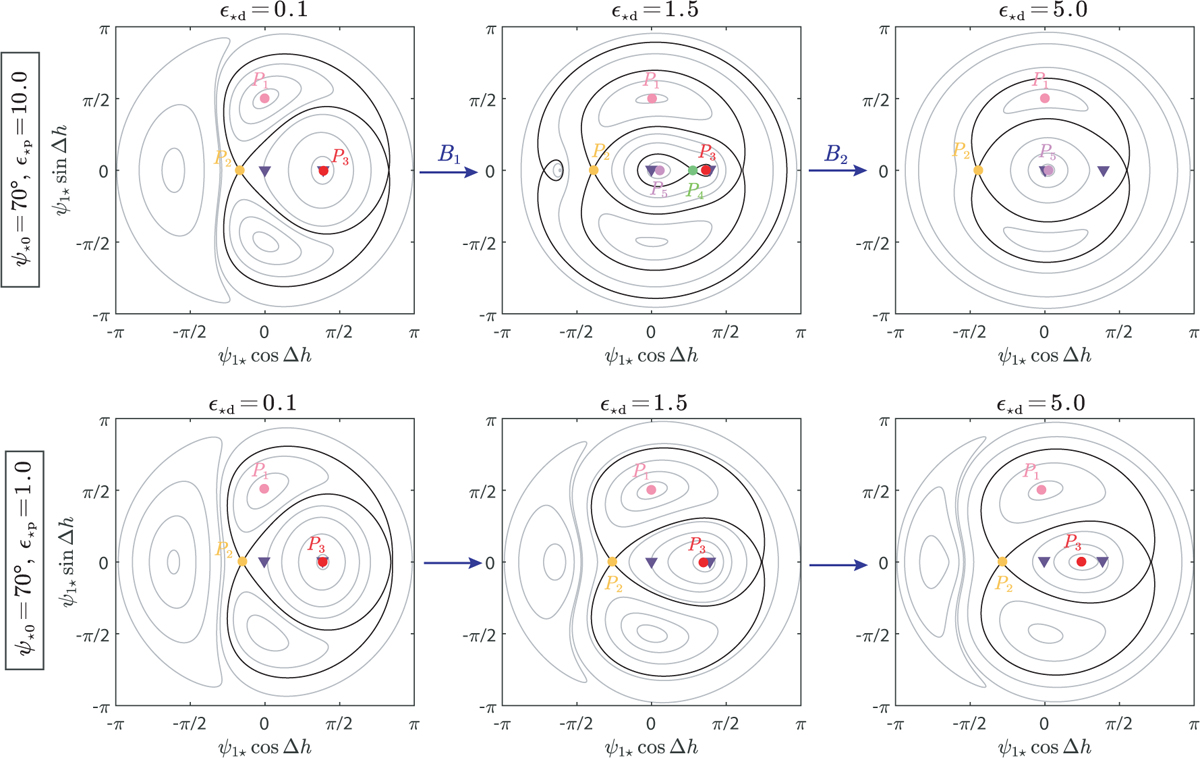
Phase portraits for ψ⋆0 = 70° presented in the (ψ1⋆ cos Δh, ψ1⋆ sin Δh) plane, where Δh represents the difference in the longitudes of the ascending node between the inner and outer orbits. These portraits were generated by plotting level curves of the perturbing Hamiltonian (Eq. (33)). In the upper panels, ϵ⋆p = 10.0 and ϵ⋆d = 0.1, 1.5, and 5.0, respectively. In the lower panels, ϵ⋆p = 1.0 with the same variations in ϵ⋆d. Equilibrium points are indicated with colored markers. The projections of ![]() and
and ![]() on this plane are denoted by filled triangles.
on this plane are denoted by filled triangles.
Current usage metrics show cumulative count of Article Views (full-text article views including HTML views, PDF and ePub downloads, according to the available data) and Abstracts Views on Vision4Press platform.
Data correspond to usage on the plateform after 2015. The current usage metrics is available 48-96 hours after online publication and is updated daily on week days.
Initial download of the metrics may take a while.