Fig. 8
Download original image
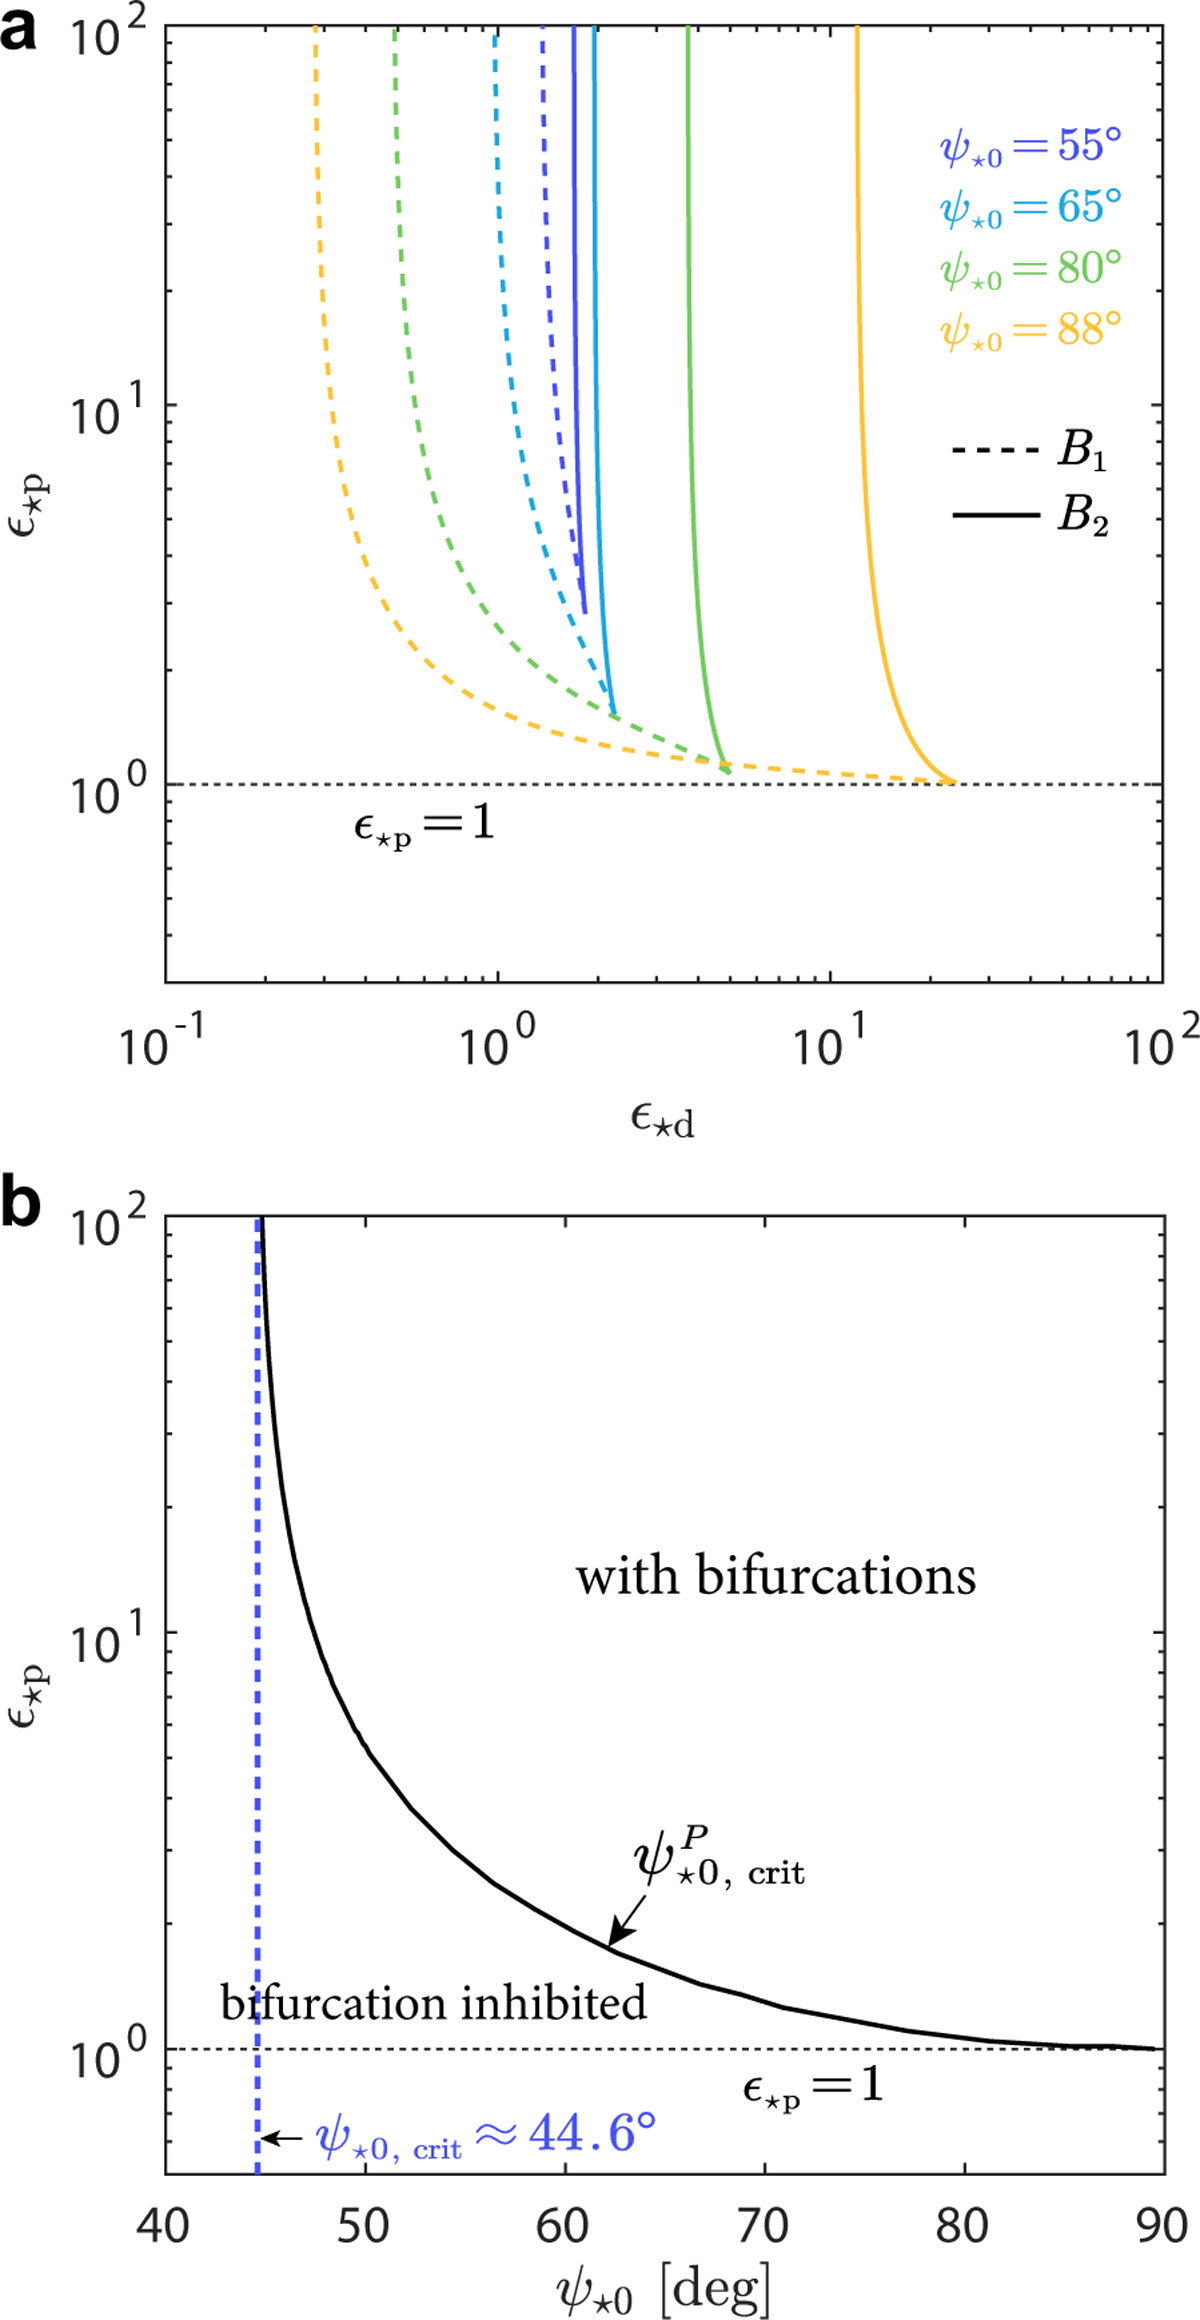
Bifurcation curves for hierarchical systems. (a) Bifurcation curves for several high values of ψ⋆0 presented in the (ϵ⋆d, ϵ⋆p) space. The dashed and solid curves represent the bifurcations B1 and B2, respectively. (b) Bifurcation curves in the (ψ⋆0, ϵ⋆p) space, where the curves for B1 and B2 degenerate into one curve. The softening scale is chosen as β = 0.01.
Current usage metrics show cumulative count of Article Views (full-text article views including HTML views, PDF and ePub downloads, according to the available data) and Abstracts Views on Vision4Press platform.
Data correspond to usage on the plateform after 2015. The current usage metrics is available 48-96 hours after online publication and is updated daily on week days.
Initial download of the metrics may take a while.