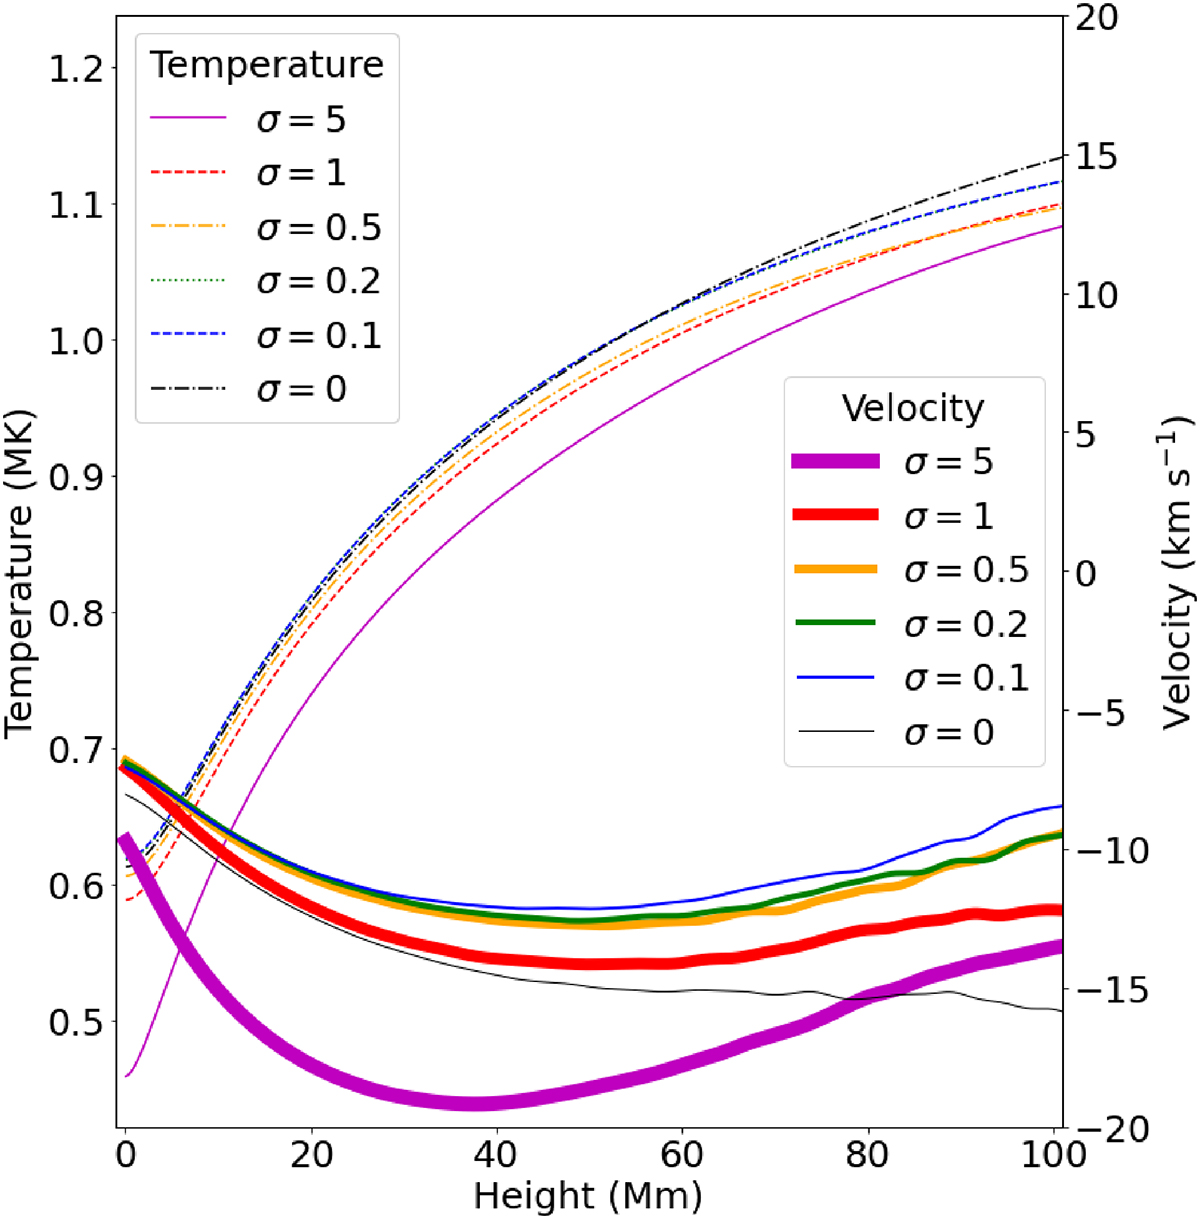
Fig. 4.
Download original image
Temperature (in MK given by various line styles and colors) and velocity (in km s−1 given by various thickness and color solid lines) are given as a function of height (Mm) plotted at time t = 1800 s, where the reflection coefficient (σ) corresponding to Alfvén wave energy reflection is varied. The reflection coefficients (σ) are 5 (pink), 1 (red), 0.5 (orange), 0.2 (green), 0.1 (blue), and 0 (black) which leads to no Alfvén wave heating. The various thicknesses of lines refer to the velocity and the various line styles refer to the temperature.
Current usage metrics show cumulative count of Article Views (full-text article views including HTML views, PDF and ePub downloads, according to the available data) and Abstracts Views on Vision4Press platform.
Data correspond to usage on the plateform after 2015. The current usage metrics is available 48-96 hours after online publication and is updated daily on week days.
Initial download of the metrics may take a while.